AMA Public Hospital Report Card 2020
The release of the AMA’s 2020 Public Hospital Report Card comes at a time when our public hospitals are front and centre in the response to the COVID-19 pandemic. It is a time when many Australians, young and old, rely on the clinical excellence and resourcing available in our public hospitals more than ever. Australia achieves some of the best health outcomes in the world. The care provided in public hospitals is a large part of this achievement.
This report uses data published by the Australian Institute of Health and Welfare to summarise some important trends in public hospital performance over time. The findings show access to public hospitals treatment in many jurisdictions is deteriorating and public hospital waiting times are getting worse. Compared to 2017-18, no State or Territory improved public hospital performance in 2018-19 by one per cent or more for the four indicators examined in this Report Card.
In 2018-19 more than 8.3 million patients presented to public hospital emergency for treatment. More than three million emergency patients required urgent care, but only 63 per cent were treated on time. In 2018-19 emergency patients were more likely to require time urgent care compared to nine years ago. The number of emergency patients who require a subsequent admission after their emergency treatment rose between 2013-14 and 2018-19 at nearly twice the rate of overall emergency presentations, and 3.5 times the rate of population growth. It is disappointing that public hospital bed shortages meant in 2018-19, over half (54 per cent) of all emergency patients who needed a subsequent admission waited longer than four hours to be transferred to a ward bed.
Access to public hospital elective surgery is stagnant. In 2018-19 more patients were added to elective surgery waiting lists than were admitted for their elective surgeries. The national median waiting time for elective surgery was the worst performance since 2001-02. In 2018-19, only two states improved the proportion of Category 2 elective surgery patients admitted within 90 days. The performance of all other jurisdictions was either no better than the year before, or worse.
The graphs in this report card clearly show a decline in public hospital performance since it peaked in 2013-14. Quality care, best-practice care, world-leading patient outcomes, cannot be achieved and sustained unless public hospital funding is also calculated on the costs of providing best-practice care and timely access. The public hospital funding formula that has been extended for another five years to 2025, does not do this. The Commonwealth contributes 45 per cent of the efficient growth in public hospital activity, capped at 6.5 per annum. The Australian Institute of Health and Welfare reports State public hospital funding increased by 3.6 per cent on average each year over the decade (2007-08 to 2017-18) while Commonwealth funding increased 3.9 per cent each year over the same ten year period. Most of this Commonwealth growth funding reflects increased public hospital services volume. In 2020-21, the Commonwealth share of public hospital funding will be indexed by just 2.1 per cent. In the same year, public hospital nursing salaries alone are scheduled to increase by around 2.5 per cent per annum in most jurisdictions. This rate of Commonwealth funding indexation is just too low. The AMA recognises State governments contribute a larger quantum of funding per annum to public hospitals than does the Commonwealth, but the rate of growth funding off this higher base from most jurisdictions is disappointingly low.
When public hospital funding is considered per person, average annual growth in Commonwealth public hospital funding over the decade (2007-08 to 2017-18) is just 2.25 per cent. In comparison, three States recorded 3-4 per cent funding growth per person on average each year over the decade, but the other five state governments recorded annual funding growth of just 1-2 per cent.
It is important that public hospital services are efficient. The AMA applauds the substantial efficiencies public hospital doctors and nurses have achieved over the last three years by reducing patient length of stay. These initiatives reduce per patient hospital treatment costs, but the efficiency gains are under-minded by inadequate public hospital budgets that exacerbate already long waiting times for public hospital elective surgery and bed block on wards that cause the sickest emergency patients to wait too long for a suitable ward bed for ongoing care. Under-funding public hospitals perversely perpetuates avoidable patient complications, longer patient hospital stays and higher costs.
COVID-19 is a timely reminder of the importance of public hospitals and the need to properly resource them. We have an ageing population, and as people age, they are more likely to need public hospital treatment. People aged 65 years or more already account for 40 per cent of all public hospital separations. Rising chronic disease rates also translate into demand for public hospital services. Despite the downstream costs to the health sector, and the impact of chronic disease on individual well-being, too little is done to bring these rates down.
While considerable attention has been focused on COVID-19, to keep as many people as safe as possible, patient participation in cancer screening, general practice check-ups and diagnostic testing has declined. There is likely to be a backlog of patients for whom urgent access to treatment will now be required because the opportunity for early intervention has been missed. This Public Hospital Report Card shows public hospitals do not have the idle capacity, or sufficient funding needed to rapidly expand the volume of public hospital care for those who will urgently need it. This needs to change.
For twenty years public hospital capacity in Australia has been supplemented by private hospitals, underpinned by government subsidised private health insurance. This balance between public and private hospitals is increasingly precarious. Even before the COVID-19 impact on the economy, private health insurance membership had started to decline as wages growth for younger cohorts remained stubbornly flat and premium increases forced many young people out of the health insurance market. The 2020 Public Hospital Report Card confirms the importance of preserving the additional hospital capacity in the private hospital sector – our public hospitals are in no shape to take on even more.
It is therefore critical that the Commonwealth acts quickly to preserve and improve the quality and quantity of health care delivered in our public hospitals by:
- providing adequate funding to cover the predicted increase in demand for public hospital services,
- recognising the impact of COVID on state government budgets and the limits on their ability to fund growth in public hospital services,
- acting immediately to address the ongoing fall in private health insurance rates in order to preserve the capacity of the public hospital system to provide care to those who need it most,
- supporting General Practice to deliver high quality primary and preventive care in order to prevent avoidable hospital admissions.
The AMA will continue to advocate for changes to support high-quality health care delivery in public hospitals, but the very clear message is that change is urgently needed to keep our public hospitals at a world standard as the impact of the COVID pandemic flows through the economy and our health system.
Dr Omar Khorshid
Federal AMA President
ON THIS PAGE
National Public Hospital Performance
- Key Findings
- Public Hospital Capacity
- Emergency Department waiting and treatment times
- Elective surgery waiting and treatment times
- Elective surgery within clinically recommended timeframes
- Commonwealth funding for public hospitals
State by State Public Hospital Performance
- New South Wales
- Victoria
- Queensland
- Western Australia
- South Australia
- Tasmania
- Australian Capital Territory
- Northern Territory
Data Sources
KEY FINDINGS
Continual decline in public hospital bed numbers
- Available hospital beds per 1,000 population continue to decline. In 2017-18 beds per 1,000 resident population dropped to 2.51, lower than the 2.55 beds per 1,000 resident population the previous year (2016-17).
- Cohorts aged 65 years or more, used 40 per cent of all public hospital separations in 2017-18. Once admitted, this cohort remain hospitalised for 33 per cent longer than all other age cohorts.
- In 2017-18, the ratio of public hospital beds for every 1,000 people aged 65 years and older declined for the 26th consecutive year to 16.0. One hospital bed per 1,000 population aged 65 years or more has been lost in just the last two years.
Emergency department care – what are the trends and how timely is the care?
- Emergency patients are increasing in number, more likely to need time urgent treatment and more likely to need a subsequent admission.
- In 2018-19 more than 8.3 million patients presented to a public hospital emergency department – an increase of 4.2 per cent on the previous year.
- In 2018-19 more than 3 million emergency patients required Urgent treatment, but only 63 per cent were treated on time. In other words, more than a million emergency patients who needed Urgent treatment waited longer than clinically recommended.
- Performance in some jurisdictions was much worse than the national average. The Australian Capital Territory treated less than one-third of all Urgent emergency patients within 30 minutes. South Australia and Western Australia treated less than half of all Urgent emergency patients within the recommended 30 minutes.
- In 2018-19 emergency patients were more likely to require time urgent care compared to nine years ago. In 2009-10, around 43 per cent were assigned to Resuscitation, Emergency or Urgent treatment categories. By 2018-19 this proportion had risen to 53 per cent.
- Between 2013-14 and 2018-19, the number of emergency patients who required a subsequent admission also increased by 5 per cent on average, each year. The increase is 1.73 times the rate of growth in total emergency presentations each year, and 3.5 times the rate of population growth.
- However, even the best performing states, managed to transition only around 1 in 2 emergency patients to a suitably staffed ward bed within four hours.
- Bed block on public hospital wards means patients least likely to leave an emergency department within 4 hours are the sickest. In 2018-19 only half of all patients who needed Resuscitation or Emergency care, and 61 per cent of Urgent patients, left emergency within four hours.
- Delayed ongoing treatment, risks the development of patient complications, poorer patient outcomes, longer length of stay and higher costs for already tight public hospital budgets.
Elective surgery – how timely is it?
- Access to public hospital elective surgery is stagnant. The median waiting time for public elective surgery is getting longer. In 2018-19, the national median waiting time for public elective surgery was 41 days – the worst performance since 2001-02.
- In 2018-19 more patients were added to the public hospital elective surgery waitlist (893,031) than were admitted for their surgery (758,136).
- Elective surgery accounted for just 11 per cent of total public hospital admissions for the last three years (2014-15 to 2017-18).
- In 2018-19 elective admissions per 1,000 population was negative 0.4 and the average annual growth in elective surgeries per 1,000 population has been stagnant (0.5 per cent) since 2014-15.
- In 2018-19 at a national level, only 80.5 per cent of Category 2 elective surgery patients were admitted within 90 days, compared to 83.2 per cent the year before. Victoria and the Australian Capital Territory were the only two jurisdictions to improve their performance on this measure. The performance of all other jurisdictions was either no better than the year before or worse.
- Official elective surgery statistics are very likely to under-estimate the complete length of time public patients wait for elective surgery. The AMA calls on all States and Territory Health Authorities to urgently supply hidden elective surgery waitlist data so we can all see the real number of patients who are waiting too long for elective surgery.
Public hospital funding
- Commonwealth public hospital funding increased by just 2.1 per cent in 2017-18. A disappointing decline compared to two previous years of higher growth 6.2 per cent increase in 2016-17 and 8.4 per cent increase in 2015-16.
- State governments recorded 6.7 per cent funding growth in 2017-18 after two previous periods of very low growth – only 0.1 per cent in 2016-17 and 3.7 per cent in 2015-16.
- Over the decade 2007-08 to 2017-18, average annual growth in Commonwealth funding is roughly the same as States and Territories (3.9 per cent and 3.6 per cent respectively).
- When measured in terms of public hospital funding per person, Commonwealth public hospital funding has increased by just 2.25 per cent on average, each year over the decade.
- State governments contribute a larger quantum of funding per annum to public hospitals than does the Commonwealth. But growth funding off this higher base in many jurisdictions is disappointingly low.
- Over the decade 2007-08 to 2017-18 the majority of States recorded average annual per-person funding growth of just 1-2 per cent. New South Wales (1.08 per cent); Queensland (0.76 per cent); Western Australia (1 per cent); the Australian Capital Territory (1 per cent), and the Northern Territory (1 per cent).
- Only Victoria, South Australia and Tasmania increased public hospital funding per person by 3-4 per cent on average each year over the decade.
- The new 2020-25 public hospital funding agreement delivers another five years of the same funding formula and the same chronic under-funding for public hospitals.
- The rate of Commonwealth and State funding growth falls well short of that needed to resolve the long waiting times for public hospital elective surgery and the bed block on wards that are causing the sickest emergency patients to wait too long for a suitable ward bed for ongoing care.
- Chronic underfunding, bed shortages and delayed patient care will not improve patient outcomes or reduce the cost of care. Perversely, chronic public hospital underfunding perpetuates avoidable patient complications, longer patient hospital stays and higher costs.
One of the best measures of public hospital capacity is to compare the number of available beds to the size of the population.
In 2016-17, Australia had 61,797 available public hospital beds1. In 2017-18, this total dropped by 122 to leave 61,675 available beds2. The bed reductions per 1,000 population were greatest in South Australia (-5.0) and the Australian Capital Territory (-4.7)3. At a national level in 2017-18, the number of available beds per 1,000 resident population was 2.51, a reduction from the previous year (2016-17) when there were 2.55 beds per 1,000 population4. Across all public hospitals in 2017-18, these 2.51 beds per 1,000 resident population accommodated 137 same day hospitalisations per 1,000 population and 118 overnight hospitalisations per 1,000 population5.

The likelihood of requiring a hospital bed increases with age, and Australia has a large cohort of rapidly ageing baby boomers. In 2017-18, people aged 65 years and over accounted for 15.7 per cent of the Australian population6 - up from 15.4 per cent just one year earlier (2016-17)7.
In 2017-18, the share of total public hospital separations utilised by people aged 65 years or more was around 40 per cent (39.5 per cent), despite this cohort accounting for only 16 per cent of the Australian population8. Not only are people 65 years or more likely to be admitted, but the duration of their admission is 33 per cent longer compared to all other age cohorts9. The public hospital services utilisation rate for this older cohort is also intensifying. In 2009-10, people aged 65 years and over accounted for 37 per cent of total public hospital admissions10. By 2012-13 they utilised 38.5 per cent11, in 2016-17, their utilisation rose to 39.2 per cent12, and in 2017-18 it continued towards 40 per cent (39.5 per cent13).

Our ageing population has an elevated likelihood of requiring a hospital bed and remaining admitted for longer. The ratio of available hospital beds per 1,000 residents aged 65 years or more is an important measure of public hospital capacity.
In 2017-18, the ratio of public hospital beds for every 1,000 people aged 65 years and older declined for the 26th consecutive year to 16.014. Public hospitals have lost one bed per 1,000 population aged 65 years or more, in just the last two years.

Pressure on public hospital emergency departments continues to increase. In 2018-19, there were 8,352,192 emergency presentations to Australian public hospital emergency departments – a 4.2 per cent increase on the previous year15. This rate of growth in the 12 months to 2018-19 is slightly higher than the 3 per cent average annual growth recorded since 2013-1416.
Older cohorts are also over-represented in emergency statistics. Although patients aged 65 years or older make up about 15.7 per cent of the population, in 2018-19 they accounted for 22 per cent of all emergency presentations17. Not only do people aged 65 years or older present to emergency more frequently, but they are also more likely to require urgent care. In 2017-18, 65 per cent of patients aged 75 or older were assigned to one of the three most urgent triage categories18. 
Patients seen within clinically recommended timeframes
Under the National Health Performance Framework, public hospital emergency department performance is measured against the following two indicators:
- Proportion of patients seen within the clinically recommended timeframes set by the Australasian Triage Scale; and
- Length of stay for emergency department care, proportion of patients staying for four hours or less.
In 2018-19, across all triage categories, the proportion of emergency patients seen within the clinically recommended timeframe dropped to 71 per cent19, down from 75 per cent in 2013-1420, just five years earlier.
In 2018-19, of the nearly 8.3 million people who presented to a public hospital emergency department, 38.5 per cent were assessed as requiring Urgent treatment21. In some jurisdictions, closer to half of all emergency presentations were assessed as Urgent. In 2018-19, nationally there were 3,161,155 people assessed to need Urgent emergency care, and only 63 per cent were seen within the recommended 30 minutes22.

This means that nationally, more than one million Australians (1,169,627) who presented to emergency and were assessed as requiring Urgent care waited longer than clinically recommended23. Only New South Wales and Victoria performed better than the national average. The Australian Capital Territory treated less than one-third of all Urgent patients within 30 minutes. South Australia and Western Australia treated less than half of all Urgent emergency presentations within the recommended 30 minutes24.
At a national level, performance against this measure peaked in 2013-14 when 70 per cent of Urgent emergency triage patients were seen within clinically recommended timeframes. Since then national performance has declined, with performance each year worse than the year before.

The performance decline coincides with the 2014-15 Federal Budget announcement to substantially change the Commonwealth funding contributions to public hospitals, that the Federal Government budget papers estimated would save the Federal government at least $1.8 billion over four years from 2014-1525. The National Partnership Agreement on Improving Public Hospital Services was also cancelled in the 2014-15 Federal Budget, effective 1 July 2015. These changes were estimated to withdraw an additional $201.1 million in public hospital funding over three years from 2015-1626.
The drop in public hospital funding and the decline in public hospital performance from this time on, strongly suggests a relationship between emergency department performance and resourcing.
Emergency patient acuity is also rising. In 2009-10, the proportion of patients assigned to the three most urgent triage categories (Resuscitation, Emergency and Urgency) was around 43 per cent27. In 2018-19 over half (53 per cent) of all emergency patients were assigned to the same three most urgent triage categories28. This suggests the urgency of treatment required by patients on arrival at emergency is rising.

The Australian Institute of Health and Welfare (AIHW) emergency data also shows the likelihood an emergency patient will require a subsequent admission is rising. Between 2013-14 to 2018-19 total emergency admissions increased by 3 per cent on average each year, but the average annual increase in emergency patients who require a subsequent admission has been 5.2 per cent. The rate of growth in emergency patients who are subsequently admitted is 1.73 times higher than the rate of growth in total emergency presentations each year, and 3.5 times the rate of population growth29 30. Despite the growth in emergency presentations that require a subsequent admission, bed shortages are delaying the transition of emergency patients to suitable public hospital ward beds for ongoing care.
Patients leaving emergency within four hours
The proportion of emergency department presentations completed within four hours indicates whether Australians receive appropriate high quality and affordable hospital care. Patients are considered to have completed their visit to the emergency department when they physically leave (regardless of whether they were admitted to the hospital, were referred to another hospital, were discharged, or left the hospital at their own risk).
Graph 3 shows that in 2018-19, the proportion of people (all triage categories) who completed their emergency presentation within four hours or less declined a further percentage point to 70 per cent. This is down from 71 per cent in 2017-18 and 73 per cent in 2015-1631. It is a trend of worsening performance on this indicator, not an improvement.
Patients least likely to leave emergency within four hours are the sickest. In 2018-19, across all public hospital emergency departments, only 53 per cent of patients assigned to the triage category Resuscitation, 57 per cent of Emergency patients and 61 per cent of Urgent patients left within four hours32. Of those who were subsequently admitted, fewer than half (46.7 per cent) left the emergency department within four hours33.
There is no official data to record public hospital bed occupancy rates.
Hospitals cannot operate at 100 occupancy as spare capacity is needed to meet seasonal and unplanned demand spikes. The delayed transition of patients from emergency departments to suitable ward beds strongly suggests inadequate public hospital bed numbers. Without sufficient bed numbers, patients cannot flow through the system. The delayed transition of high acuity patients out of the emergency department diverts emergency physicians away from patients still waiting for emergency treatment. Delayed care risks the development of patient complications, poorer patient outcomes, longer length of stay and, higher costs for already tight public hospital budgets.

The AMA notes the latest Independent Hospital Pricing Authority (IHPA) data shows that the average cost per public hospital emergency department treatment in 2017-18 was $705 – up from $666 just one year earlier34. It is extremely difficult to achieve emergency department efficiencies when waiting rooms are over-crowded, patient acuity on arrival is rising, and ward bed-block prevents the transition of very sick patients out of emergency to the ward for ongoing care.

Elective surgery is any form of surgery considered medically necessary, but which can be delayed for at least 24 hours.
Nationally, in 2018-19, there were only 758,136 public hospital elective surgery admissions35. Between 2017-18 and 2018-19, growth in elective admissions per 1,000 population was negative (-0.4 per cent)36. Indeed, the average annual growth in elective surgeries per 1,000 population has been virtually stagnant since 2014-15, increasing by just 0.5 per cent on average each year37.

Between 2014-15 to 2017-18 public hospital admissions from elective surgery waiting lists have consistently accounted for just 11 per cent of total public hospital admissions each year38. The proportion of total admissions allocated to elective surgery in any particular hospital will vary. Large tertiary hospitals would be expected to have a higher proportion of their hospital admissions used for elective surgery than smaller hospitals. Nevertheless, the national figures represent the relatively limited proportion of total admissions used for procedures on the elective surgery waiting lists.
For the elective surgery that is provided in public hospitals, the Australian Health Performance Framework includes the following two performance indicators that measure the provision of timely elective surgery:
- The median waiting time for elective surgery; and
- The percentage of patients treated within the clinically recommended times.
Median waiting time
The median waiting time indicates the number of days within which 50 per cent of patients were admitted for their elective procedure. Half of the patients had a shorter wait time than the median, and half had a longer waiting time.
The Australian Institute of Health and Welfare elective surgery statistics for 2018-19 shows across all three clinically indicated elective surgery categories, the median waiting time for an elective surgery procedure in 2018-19 was 41 days39. This is one day longer than last year (2017-18), eight days longer than in 2008-09, and the worst performance against this measure since 2001-02.


There are three elective surgery clinical urgency categories:
- Category 1 - clinically indicated within 30 days.
- Category 2 - clinically indicated within 90 days.
- Category 3 - clinically indicated within 365 days.
Nationally, in 2018-19, Category 1 (most urgent) accounted for 27.8 per cent of total elective admissions, Category 2 accounted for 38.2 per cent and Category 3 accounted for 34.0 per cent40. This distribution is consistent with the distribution in 2017-1841.
Graph 5 shows that, in 2018-19, only 80.5 per cent of Category 2 elective surgery patients (all States and Territories) were admitted within the clinically recommended 90-day period. Nearly 3 percentage points (2.7) lower than the year before42.
Performance against this measure varies substantially between jurisdictions. Victoria and the Australian Capital Territory were the only two jurisdictions to register improved performance in providing elective surgery to Category 2 patients within the clinically recommended timeframe. All other jurisdictions registered a performance that was either no better than the year before, or worse than the year before (see Part 2 of this Report).
Nationally, in 2018-19, there were 893,031 elective surgery patients added to the public hospital elective waiting lists. Fewer were removed (886,418), and fewer still were admitted for their surgery (758,136)43. These published elective surgery statistics do not provide a full account of the total unmet need for public hospital elective surgery. This assessment requires all States and Territories to provide data in a consistent format on the number of public patients who require elective surgery, but are waiting on separate wait lists to see a public hospital specialist before moving to the official elective surgery statistics.
The AMA has been calling for the publication of this data for years. Without it, we have no way of measuring the extent of unmet need for public patient elective surgery. The stagnant 11 per cent of total public hospital admissions allocated to patients on elective surgery wait list each year between 2014-15 and 2017-18, is at odds with the year-on-year rise in the volume of other demand-driven public hospital service streams and at odds with the expected rise in public hospital elective surgery volume required to treat patients who have recently dropped their private hospital insurance44.
In May 2020, the Commonwealth and all State and Territory Governments signed a new public hospital funding Addendum, which amends the National Health Reform Agreement for the period 1 July 2020 to 30 June 202545. For the most part, this new agreement simply extends the current public hospital funding formula for another five years. The Commonwealth will continue to meet 45 per cent of the efficient growth in public hospital activity, capped at 6.5 per cent annum’. Different funding models will continue to apply to smaller public hospitals where 100 per cent activity-based funding is unsustainable. While there are some exceptions to this rule for specialised services, the vast bulk of public hospitals services will continue to be funded in the same way for the next five years.

Pricing incentives will continue to apply to hospital-acquired complications and sentinel events. From 1 July 2021, public hospitals will also be financially penalised for avoidable patient re-admissions. While the new agreement considers a hospital-acquired condition is preventable if best clinical practice is provided during the admission, the AMA believes that public hospitals are not funded to deliver best practice care. Instead, Commonwealth funding pays 45 per cent of the national ‘efficient cost’. That is, average cost per weighted separation, indexed at a rate that reflects public hospital input cost increases, offset by efficiency gains. In 2020-21, Commonwealth funding will be indexed by just 2.1 per cent46. Nursing salaries alone are expected to increase by around 2.5 per cent per annum47.
Under the new 2020-25 agreement, insured patients retain the option to elect private patient treatment in a public hospital. However, there are new measures to ensure these private patient elections are entirely revenue neutral for the treating public hospital. The methodology is yet to be finalised.
Commonwealth and State Governments have agreed to investigate several long-term health reforms. Areas of interest include improved efficiency and financial sustainability, right care in the right place, which may extend to paying for value and outcomes, disease prevention and patient wellbeing and driving best practice and performance by using health data. These ambitions sound promising if the reforms are led by hospital clinicians. They will also require new investments and additional funding to succeed.
The new agreement permits the development of innovative clinical pathways designed to improve patient outcomes and better coordinated patient care. But the type of innovative hospital service cannot differ from the type of service that was in-scope for Commonwealth funds in 201048. This may change as longer-term reform details are developed49.
The new agreement recognises that coordinated patient care requires the Commonwealth and States to collaborate in joint health service planning and funding at a local level that spans the continuum of care. The only Commonwealth funding to offset the cost of care coordination is the previously announced Commonwealth $100 million Health Innovation Fund to be shared amongst all States and Territories50. It appears, that once this one-off funding is exhausted, the ongoing cost of patient care coordination must be funded from within the existing Commonwealth funding envelope.
One of the few limited new Commonwealth funding announcements is a commitment to fund 50 per cent of the growth in the efficient cost of new high cost, highly specialised therapies that have been recommended by the Medical Services Advisory Committee. This additional Commonwealth funding will be exempt from the 6.5 per cent per annum growth funding cap, for two years from the time these new therapies are provided. Thereafter, these additional costs go into the funding baseline and contribute to all the other annual cost increases, leaving less scope for increased service volume before the 6.5 per cent Commonwealth funding cap is exceeded each year51.

Funding levels generated by the existing public hospital funding formula that ended on 30 June 2020 are underwhelming. The latest AIHW data shows that in the 12 months to 2017-18, Commonwealth public hospital funding (constant prices) increased by just 2.1 per cent52, a disappointing decline in the rate of Commonwealth funding growth compared to a 6.2 per cent increase the year before (2016-17) and 8.4 per cent increase in 2015-1653. Over the decade 2007-08 to 2017-18, Commonwealth funding increased by 3.9 per cent on average each year54. In comparison, State Government funding grew by 6.7 per cent in the 12 months to 2017-18, but only 0.1 per cent in 2016-17 and 3.7 per cent in 2015-16. Over the decade, State funding increased by 3.6 per cent on average each year – a rate of average annual growth very similar to the Commonwealth55. In the AMA’s view, these funding growth rates fall well short of that needed to cover annual public hospital input cost increases, and a higher volume of services to provide timely patient treatment.
While aggregate sums, and rates of funding growth to public hospitals from the Commonwealth and States are important, they are hard to interpret. The Australian population grows by approximately 1.5 to 1.6 per cent per annum. Another way to interpret the adequacy of public hospital funding is to examine it on a per person basis.
On this measure, graph 6 shows that State Governments allocate substantially higher levels of public hospital funding per person than does the Commonwealth.
Average annual growth in total Commonwealth per person funding (constant prices) for public hospitals increased by less than 2 per cent (1.55 per cent) in the first half of the decade (2007-08 to 2012-13), and only 3 per cent (2.95 per cent) in the second half of the decade (2012-13 to 2017-18). Average annual growth in Commonwealth public hospital funding per person (constant prices) over the decade is just 2.25 per cent56 57.
Only three State Governments allocated a rate of public hospital funding growth from own source revenue of 3-4 per cent per person on average each year over the decade (Victoria, South Australia and Tasmania). The remaining five State Governments allocated funding growth of just 1-2 per cent per person per annum. (See Part 2 of this Report)58.
In this very tight Commonwealth and State funding environment, public hospital doctors, nurses and other staff have achieved considerable increases in admitted patient throughput to reduce public hospital average activity costs. Nationally, in 2017-18, same day acute admissions in public hospitals accounted for more than half (56.3 per cent) of all admitted acute care separations - a result achieved after three consecutive years of gain in the proportion of admitted patients treated on a same day basis59. If patients do remain in hospital overnight, their average length of stay is 4.19 days. This overnight average length of stay has also decreased for the last three years60.
The AMA applauds the national efficiency gains public hospitals have achieved to generate the latest national average acute admitted patient cost growth figure of just 1.9 per cent61. Efficiencies have been achieved in large part by reductions in the average length of patient admissions, and other innovations driven by doctors and nurses to create efficient models of care.
However, as explained in our 2019 Report Card, Commonwealth contributions to public hospital funding activity are indexed each year, but the public hospital efficiency gains from the previous period are built into this. It means Commonwealth funding is indexed at a rate that reflects public hospital input cost increases, offset by efficiency gains. While the latest data shows the annual rate of price indexation for public hospital funding is 2.1 per cent per annum62, 62 per cent of total public hospital recurrent spending is attributed to salaries and wages63. Nurses’ wages growth is currently trending at around 2.5 per cent per annum64. The greater the magnitude of difference between the rate of Commonwealth funding price indexation, compared to underlying hospital input cost growth (salaries and technology), the greater the pressure on public hospitals to make up the hospital activity funding gap via efficiencies.

Figure 1
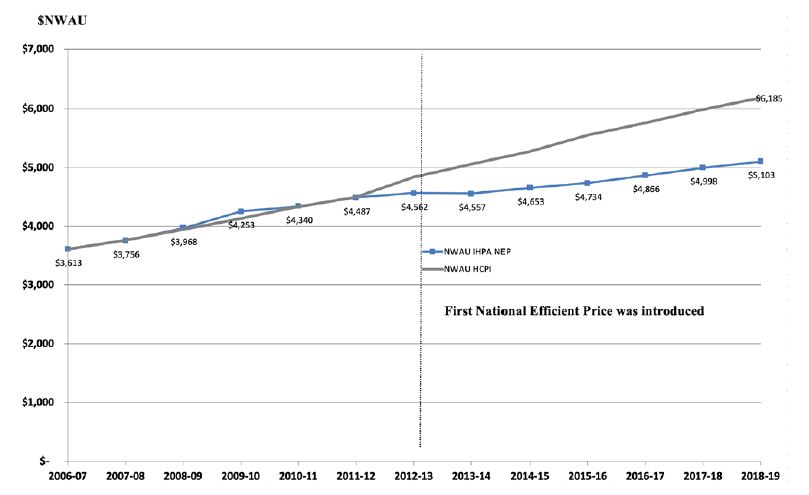
Figure 1 compares Commonwealth funding price indexation under current arrangements to Australian Bureau of Statistics (ABS) Health Consumer Price Index (CPI). Up until the 2012-13 year (the first National Efficient Price), the two series were almost identical in each year. After the introduction of Activity Based Funding and the National Efficient Price, this series increases at a very slow rate. The Health CPI series captures what would have occurred without the productivity gains achieved through the innovation of public hospital staff. The savings banked by the Commonwealth should be re-invested back into the system to boost public hospital service levels and contribute to the investments public hospitals will need to make to achieve the next round of efficiencies. This reinvestment is just a small part of the additional funding public hospitals need.
This section includes performance information for each State and Territory using available data sources.
A summary of State performance is shown in Table 1. It represents 2018-19 performance compared to the previous year.
This section includes performance information for each State and Territory using available data sources.


The figures below, and our quarterly reports since then, show that even before COVID-19, the NSW public health system was one under strain. Throughout each year, NSW hospitals are facing record or near-record demand and this pressure continues to build. We can no longer blame these increases on one-off surges due to “a bad flu season”.
NSW has invested in hospital redevelopments; however, whilst we have bigger buildings and greater capacity, workforce shortages mean hospitals are not operating to their full potential. Our surgical waitlists are unacceptably long. We need a long-term solution to improve the capacity of our public hospital system to treat these patients.
The care that patients receive in NSW is world-class and our staff perform exceptionally despite the demands put upon them. Workforce levels have not kept pace with demands from a growing and ageing population that is presenting with increasingly complex, chronic conditions. These factors will continue to challenge NSW, as the population is expected to grow by 14 per cent across the next 10 years. Meanwhile, the 65-year-old demographic is predicted to grow by 33 per cent, to make up nearly one-fifth of the State’s population by 2026.
The NSW public hospital system is busting at the seams and needs strategic intervention to reduce presentations, reduce admissions, and optimise public hospital care to make sure we are treating our patients in the right place, at the right time.
This data, which reflects a period prior to the COVID-19 pandemic, shows a Victorian healthcare system that is stretched as it tries to respond to the healthcare needs of a booming population increasingly turning away from private health insurance, living longer and experiencing more complex disease.
AMA Victoria calls on the state government to apply greater focus and investment into preventative health measures to help reduce the need for expensive public hospital care.
We reiterate our call for greater transparency on wait times through the introduction of a new system that publicly states the time from first referral by a general practitioner to treatment.
Our current system publicly reports on the time period that is triggered once a patient has seen a specialist and has been allocated a time for surgery.
This is only one part of the patient journey though.
Our reporting system should be triggered when a patient sees their general practitioner and is referred for a specialist outpatient appointment. This part of the patient journey can take months and is often referred to as ‘the hidden wait list’.
Measuring elective surgery waiting times from the point of referral right through to treatment, and ensuring those wait lists are transparent, would allow GPs and patients to make more informed clinical, referral and treatment decisions.
We look forward to an honest conversation with our State Government concerning Victoria’s real wait times to ensure greater accountability from government and public hospitals and meaningful improvement to the system.

Queensland is tracking quite well as evidenced in this year’s AMA Public Hospital Report Card, broadly maintaining existing levels, however, there are some areas for concern.
While Queensland benefits from higher per capita public hospital spending than other states, the actual increase year on year allocation from the State Government has been progressively dropping in Queensland with a growth rate now less than one per cent. The Surgery Connect program, operating in Queensland for over a decade, has helped keep our waiting lists down as well as servicing the most disadvantaged in our society. Regional and rural areas of Queensland face particular challenges - private specialists are often not being engaged by the public hospitals with many Health and Hospital Services (HHS) stopping “intermediate” access where these specialists can operate on patients without private health insurance at greatly reduced costs. Intermediate lists are good for hospitals and patients, increasing activity and improving turnover times for operating lists. We need to continue to draw on these private proceduralists in regional areas, rather than send patients to Brisbane for treatment, thereby relieving the financial and social disruption to the families involved.
If we are to make a serious attempt at meeting our set targets in public hospitals, it is vital for local health and hospital services to continue to build strong relationships with private specialists in their area. It is often hard to get them there, but once they are there, they need to be valued. The perception that you can only get into a training program by working in the major Brisbane tertiary referral hospital also means it can be difficult to maintain a junior doctor workforce outside of south-east Queensland. There are certainly ongoing challenges to providing medical services to Australia’s most heavily decentralised state.

Western Australia’s public hospital system is straining under the pressure of successive years of defunding coupled with the lowest number of available public hospital beds compared to every other state in Australia. WA’s report card reflects this, with fewer patients being seen in recommended timeframes in our emergency departments and longer median wait times for elective surgery.
While WA continues to outperform the Commonwealth in terms of percentage of emergency department visits completed in four hours or less, year-on-year data is on a downward trend.
The corollary to an overburdened, underfunded public hospital system is one that is more inefficient and expensive to operate – another disappointing takeaway from WA’s data

South Australia has been a perennial and disappointing laggard over the last decade in the areas of time taken to be seen in emergency departments and waiting times for elective surgery.
Of greater concern has been the trend of worsening response times in emergency departments with the only glimmer of hope being some improvements in elective surgery waiting lists. These have occurred during periods of great change in the SA Health system with a new major hospital being built, the roll out of a new electronic record system, an attempt at sweeping change in the controversial “Transforming Health” initiative and despite SA having the highest per capita public hospital funding.
One hopes that the new State Government which was handed responsibility for health during the latest figures will change the focus away from buildings and big-ticket initiatives, to the “on the ground” needs of patients, doctors and other health workers - so that SA’s figures can improve.

The Tasmanian hospital system has been under growing pressure for some years coping with an ageing population, increasing incidences of chronic disease and tightening budgets. The result has seen regular news headlines of ambulance ramping, emergency department overflows and blowouts in elective surgery lists. However, there was light at the end of the tunnel with the State Government announcing a significant injection of $600m over four years into the health budget in February of this year and new beds coming on line in Hobart with the opening of K Block at the Royal Hobart Hospital. But, then COVID-19 hit.
Spending in health has once again blown out to cover the increased costs of COVID preparedness and elective surgery lists have worsened with elective surgery virtually non-existent for some weeks. During the lockdown phase of our COVID response, our Emergency Departments received some respite as people stopped attending. However, as restrictions have lifted, the old problems of ramping and overcrowding of our EDs have returned to the Royal Hobart Hospital and Launceston General Hospital. The private sector is being used to help to work through the elective surgery lists, but with over 11,000 Tasmanians waiting on the list, it will take time. New theatres opening at the Royal Hobart Hospital will hopefully also help to put a dent in the waiting lists. The North-West has been through the COVID-19 mill, with its problems widely reported. While services are up and running again, it will take time for staff to work through the impact of the COVID-19 outbreak on them and their patients.
All in all, 2020 has been an unusual year, one we will feel the repercussions of, for many more to come in our hospitals, as well as across the community. The support of AMA Tasmania for doctors will be even more important.
The ACT public hospital system remains under significant pressure with every indicator showing the Territory is lagging behind the national average. To compound the situation, many of the indicators also show that the gap is widening.
Despite this, what we do know is that the ACT medical workforce is committed, hard-working and provides excellent care. The challenge then for the ACT, remains to get the allocation of resources right given its small scale, the relative lack of co-ordination between the largest public hospitals and cross-border issues with NSW that, combined, lead to higher operating costs.
While the recent Culture Review may have been triggered by the growing pressures on the system, the way forward has to involve improving the culture, supporting the staff and committing to an improved funding model to meet the unique demands of the ACT. Absent these things, it is hard to see significant improvement in the ACT’s performance in the near future.
However, the Australian Institute of Health and Welfare 2018-19 public hospital performance data shows 46 per cent of patients in the Northern Territory who required urgent emergency treatment, waited longer than clinically recommended. Similarly, in 2018-19 nearly one in three Tasmanian emergency patients had not completed their emergency presentation within 4 hours. The consequence of delayed hospital treatments is significant and can mean an increased risk of patient complications, delayed pain relief, and longer length of hospital admission. The Northern Territory population is approximately one-third Indigenous with a significant proportion of this population scattered widely in remote and rural areas. The problems of providing effective primary care to this widely dispersed population means the rate of avoidable hospital admissions in the Northern Territory is double that of other jurisdictions. The prevalence of delayed primary health care in the Northern Territory, means when a patient does present to an emergency department, timely access to hospital treatment is all the more important.
Northern Territory public hospitals have the highest pressure on bed state in Australia with acuity rates over double that of some other states. This has at times resulted in intense pressure on emergency departments with “double bunking” being frequent.
There has been a reduction in bed pressures in the early stages of COVID but with the Northern Territory being COVID free for a significant period, bed pressures have once again increased.
DATA SOURCES
- Australian Institute of Health and Welfare (AIHW) 2018, Australian Hospital Statistics: Hospital Resources 2016-17, Table 2.8, viewed 11 December 2019, https://www.aihw.gov.au/getmedia/c5fd554a-3356-474a-808a-5aab43d24708/aihw-hse-205.pdf.aspx?inline=true
- Australian Institute of Health and Welfare (AIHW) 2019, Australian Hospital Statistics: Hospital Resources 2017-18, Table 4.9, viewed 11 December 2019, https://www.aihw.gov.au/reports/hospitals/hospital-resources-2017-18-ahs/data
- Australian Institute of Health and Welfare (AIHW) 2019, Australian Hospital Statistics: Hospital Resources 2017-18, Table 4.9, viewed 11 December 2019, https://www.aihw.gov.au/reports/hospitals/hospital-resources-2017-18-ahs/data
- Australian Institute of Health and Welfare (AIHW) 2019, Australian Hospital Statistics: Hospital Resources 2017-18, Table 4.9, viewed 11 December 2019, https://www.aihw.gov.au/reports/hospitals/hospital-resources-2017-18-ahs/data
- Australian Institute of Health and Welfare 2019. Admitted patient care 2017–18, interactive data visualisatons , viewed 28 February 2020, https://www.aihw.gov.au/reports/hospitals/admitted-patient-care-2017-18/contents/interactive-data-visualisations
- Australian Bureau of Statistics (ABS) publication 3101.9, population by a single year of age, https://www.abs.gov.au/AUSSTATS/ABS@Archive.nsf/log?openagent&3101059.xls&3101.0&Time%20Series%20Spreadsheet&44190BA59EC8025DCA25836800100219&0&Jun%202018&20.12.2018&Latest
- Australian Bureau of Statistics (ABS) publication 3101.9, population by a single year of age, https://www.abs.gov.au/AUSSTATS/ABS@Archive.nsf/log?openagent&3101059.xls&3101.0&Time%20Series%20Spreadsheet&44190BA59EC8025DCA25836800100219&0&Jun%202018&20.12.2018&Latest
- Australian Institute of Health and Welfare (AIHW) 2019, Admitted patient care 2017-18, Table S3.1, viewed 25 February 2020, https://www.aihw.gov.au/getmedia/f2b929de-e178-4c9f-b7bc-8917645883db/AIHW-HSE-225-Chapter-3-data-table.xls.aspx
- Australian Institute of Health and Welfare 2019. Admitted patient care 2017–18, Table 3.1, viewed 25 February 2020, https://www.aihw.gov.au/getmedia/df0abd15-5dd8-4a56-94fa-c9ab68690e18/aihw-hse-225.pdf.aspx?inline=true
- Australian Institute of Health and Welfare 2011. Australian hospital statistics 2009–10, Chapter 7 viewed 25 February 2020, https://www.aihw.gov.au/getmedia/df7c6c88-ac5b-48f8-a346-b9dab1e64d8d/12968_chapter7.xls.aspx
- Australian Institute of Health and Welfare 2014. Australian hospital statistics 2012–13, Chapter 6, viewed 25 February 2020, https://www.aihw.gov.au/getmedia/657a6526-1dbb-413b-89a3-d8caf9d48a5f/Ch06-AHS-2012-13.xls.aspx
- Australian Institute of Health and Welfare (AIHW) 2018. Admitted patient care 2016–17: Australian hospital statistics, Table 3.2, viewed 25 February 2020 https://www.aihw.gov.au/getmedia/6c99cf83-0c55-4d6d-a9c7-0776ec97da67/aihw-hse-201-chapter-3-data-table.xls.aspx
- Australian Institute of Health and Welfare 2019. Admitted patient care 2017–18, Table 3.1, viewed 25 February 2020, https://www.aihw.gov.au/getmedia/f2b929de-e178-4c9f-b7bc-8917645883db/AIHW-HSE-225-Chapter-3-data-table.xls.aspx
- Australian Institute of Health and Welfare (AIHW) 2019, Australian Hospital Statistics: Hospital Resources 2017-18, Table 4.9, viewed 11 December 2019, https://www.aihw.gov.au/reports/hospitals/hospital-resources-2017-18-ahs/data and Australian Bureau of Statistics (ABS) publication 3101DO001,Data Cubes, Australian Demographic Statistics Tables, Table 7 Population, by age and sex Australia at 30 June 2015 to 2019 https://www.abs.gov.au/AUSSTATS/abs@.nsf/DetailsPage/3101.0Jun%202019?OpenDocument
- Australian Institute of Health and Welfare (AIHW) 2019. Australian Hospital Statistics: Emergency Department Care 2018-19, Table 2.2 viewed 27 February 2020, https://www.aihw.gov.au/reports-data/myhospitals/sectors/emergency-department-care
- Australian Institute of Health and Welfare (AIHW) 2014. Australian Hospital Statistics: Emergency Department Care 2013-14, Table 2.10 viewed 27 February 2020 https://www.aihw.gov.au/getmedia/96d50c7b-3e0e-4aec-bd80-521ff0358162/17763.pdf.aspx?inline=true and Australian Institute of Health and Welfare (AIHW) 2015. Australian Hospital Statistics: Emergency Department Care 2014-15, Table 4.12 viewed 27 February 2020 https://www.aihw.gov.au/getmedia/0fd096e0-b481-4f92-bfe8-98d72f9c8719/19527_1.pdf.aspx?inline=true and Australian Institute of Health and Welfare (AIHW) 2015. Australian Hospital Statistics: Emergency Department Care 2014-15, Table 4.12 viewed 27 February 2020 https://www.aihw.gov.au/getmedia/0fd096e0-b481-4f92-bfe8-98d72f9c8719/19527_1.pdf.aspx?inline=true and Australian Institute of Health and Welfare (AIHW) 2016. Australian Hospital Statistics: Emergency Department Care 2015-16, Table 4.12 viewed 27 February 2020 https://www.aihw.gov.au/getmedia/ed894387-423b-42cd-8949-90355666f24d/20407.pdf.aspx?inline=true and Australian Institute of Health and Welfare (AIHW) 2017. Australian Hospital Statistics: Emergency Department Care 2016-17, Table 4.12 viewed 27 February 2020 https://www.aihw.gov.au/getmedia/981140ee-3957-4d47-9032-18ca89b519b0/aihw-hse-194.pdf.aspx?inline=true and Australian Institute of Health and Welfare (AIHW) 2018. Australian Hospital Statistics: Emergency Department Care 2017-18, Table 4.12 viewed 27 February 2020 https://www.aihw.gov.au/getmedia/9ca4c770-3c3b-42fe-b071-3d758711c23a/aihw-hse-216.pdf.aspx?inline=true and Australian Institute of Health and Welfare (AIHW) 2019. Australian Hospital Statistics: Emergency Department Care 2018-19, Table 4.12 viewed 27 February 2020 https://www.aihw.gov.au/reports-data/myhospitals/sectors/emergency-department-care
- Australian Institute of Health and Welfare (AIHW) 2019. Australian Hospital Statistics: Emergency Department Care 2018-19, web report viewed 28 February 2020 https://www.aihw.gov.au/reports-data/myhospitals/sectors/emergency-department-care
- Australian Institute of Health and Welfare (AIHW) 2019. Australian Hospital Statistics: Emergency Department Care 2017-18, web report accessed on 28 February 2020, https://www.aihw.gov.au/reports/hospitals/emergency-dept-care-2017-18/contents/summary
- Australian Institute of Health and Welfare (AIHW) 2019. Australian Hospital Statistics: Emergency Department Care 2018-19, Table 5.1 viewed 28 February 2020, https://www.aihw.gov.au/reports-data/myhospitals/sectors/emergency-department-care
- Australian Institute of Health and Welfare 2018. Australian Hospital Statistics: Emergency department care 2017-18, Table 5.1, viewed 28 February 2020, https://www.aihw.gov.au/reports/hospitals/emergency-department-care-2017-18/data
- Australian Institute of Health and Welfare (AIHW) 2019. Australian Hospital Statistics: Emergency Department Care 2018-19, Table A4 viewed 27 February 2020, https://www.aihw.gov.au/reports-data/myhospitals/sectors/emergency-department-care
- Australian Institute of Health and Welfare (AIHW) 2019. Australian Hospital Statistics: Emergency Department Care 2018-19, Table S5.1 viewed 27 February 2020, https://www.aihw.gov.au/reports-data/myhospitals/sectors/emergency-department-care
- Australian Institute of Health and Welfare (AIHW) 2019. Australian Hospital Statistics: Emergency Department Care 2018-19, Table S5.1 viewed 27 February 2020, https://www.aihw.gov.au/reports-data/myhospitals/sectors/emergency-department-care
- Australian Institute of Health and Welfare (AIHW) 2019. Australian Hospital Statistics: Emergency Department Care 2018-19, Table S5.1 viewed 27 February 2020, https://www.aihw.gov.au/reports-data/myhospitals/sectors/emergency-department-care
- The Commonwealth of Australia 2014, Budget 2014-15, Budget Paper No2 2014-15 p126 and 137 https://archive.budget.gov.au/2014-15/bp2/BP2_consolidated.pdf
- The Commonwealth of Australia 2014, Budget 2014-15, Budget Paper No2 2014-15 p126 and 137 https://archive.budget.gov.au/2014-15/bp2/BP2_consolidated.pdf
- Australian Institute of Health and Welfare (AIHW) 2010. Australian Hospital Statistics: 2009-10: Emergency department care and elective surgery waiting times, Table 2.6, viewed 29 February 2020, https://www.aihw.gov.au/reports/hospitals/ahs-2009-10-emergency-department-elective-surgery/contents/table-of-contents
- Australian Institute of Health and Welfare (AIHW) 2019, Australian Hospital Statistics: Emergency Department Care 2018-19, Table S5.1 accessed on 28 February 2020, https://www.aihw.gov.au/reports-data/myhospitals/sectors/emergency-department-care
- Australian Institute of Health and Welfare (AIHW) 2014. Australian Hospital Statistics: Emergency Department Care 2013-14, Table 2.10 viewed 27 February 2020 https://www.aihw.gov.au/getmedia/96d50c7b-3e0e-4aec-bd80-521ff0358162/17763.pdf.aspx?inline=true and Australian Institute of Health and Welfare (AIHW) 2015. Australian Hospital Statistics: Emergency Department Care 2014-15, Table 4.12 viewed 27 February 2020 https://www.aihw.gov.au/getmedia/0fd096e0-b481-4f92-bfe8-98d72f9c8719/19527_1.pdf.aspx?inline=true and Australian Institute of Health and Welfare (AIHW) 2016. Australian Hospital Statistics: Emergency Department Care 2015-16, Table 4.12 viewed 27 February 2020 https://www.aihw.gov.au/getmedia/ed894387-423b-42cd-8949-90355666f24d/20407.pdf.aspx?inline=true and Australian Institute of Health and Welfare (AIHW) 2017. Australian Hospital Statistics: Emergency Department Care 2016-17, Table 4.12 viewed 27 February 2020 https://www.aihw.gov.au/getmedia/981140ee-3957-4d47-9032-18ca89b519b0/aihw-hse-194.pdf.aspx?inline=true and Australian Institute of Health and Welfare (AIHW) 2018. Australian Hospital Statistics: Emergency Department Care 2017-18, Table 4.12 viewed 27 February 2020 https://www.aihw.gov.au/getmedia/9ca4c770-3c3b-42fe-b071-3d758711c23a/aihw-hse-216.pdf.aspx?inline=true and Australian Institute of Health and Welfare (AIHW) 2019. Australian Hospital Statistics: Emergency Department Care 2018-19, Table 4.12 viewed 27 February 2020 https://www.aihw.gov.au/reports-data/myhospitals/sectors/emergency-department-care
- Australian Institute of Health and Welfare (AIHW) 2019. Health expenditure Australia 2017–18, Table 5.1b, viewed 28 February 2020, https://www.aihw.gov.au/reports/health-welfare-expenditure/health-expenditure-australia-2017-18/data
- Australian Institute of Health and Welfare (AIHW) 2020, Emergency department care 2018-19, Table 6.3 viewed 29 February 2020 https://www.aihw.gov.au/getmedia/6f15c095-e669-428c-9cef-a887cb65f3b0/Emergency-department-care-2018-19.xlsx.aspx
- Australian Institute of Health and Welfare (AIHW) 2020, Emergency department care 2018-19, Table 6.4 viewed 29 February 2020 https://www.aihw.gov.au/getmedia/6f15c095-e669-428c-9cef-a887cb65f3b0/Emergency-department-care-2018-19.xlsx.aspx
- Australian Institute of Health and Welfare (AIHW) 2020, Emergency department care 2018-19, Table 6.3 viewed 29 February 2020 https://www.aihw.gov.au/reports-data/myhospitals/sectors/admitted-patients
- Independent Hospital Pricing Authority (2020), National Hospital Cost Data Collection Cost Report, Round 22 (Financial Year 2017-18), viewed 12 February 2020, https://www.ihpa.gov.au/publications/national-hospital-cost-data-collection-report-public-sector-round-22-financial-year
- Australian Institute of Health and Welfare (AIHW) 2019. Australian Hospital Statistics: Elective Surgery Waiting Times 2018-19, Table 2.4, viewed 13 January 2020, https://www.aihw.gov.au/reports-data/myhospitals/sectors/elective-surgery
- Australian Institute of Health and Welfare (AIHW) 2019. Australian Hospital Statistics: Elective Surgery Waiting Times 2018-19, Table 2.4, viewed 13 January 2020, https://www.aihw.gov.au/reports-data/myhospitals/sectors/elective-surgery
- Australian Institute of Health and Welfare (AIHW) 2019. Australian Hospital Statistics: Elective Surgery Waiting Times 2018-19, Table 2.4, viewed 13 January 2020, https://www.aihw.gov.au/reports-data/myhospitals/sectors/elective-surgery
- Australian Institute of Health and Welfare (AIHW) 2019. Australian Hospital Statistics: Admitted Patient Care 2017-18, Table 5.1 and 6.24 viewed 13 January 2020 https://www.aihw.gov.au/getmedia/df0abd15-5dd8-4a56-94fa-c9ab68690e18/aihw-hse-225.pdf.aspx?inline=true and Australian Institute of Health and Welfare (AIHW) 2018. Australian Hospital Statistics: Admitted Patient Care 2016-17, Table 6.42, viewed 13 January 2020, https://www.aihw.gov.au/reports/hospitals/ahs-2016-17-admitted-patient-care/contents/table-of-contents and Australian Institute of Health and Welfare (AIHW) 2017. Australian Hospital Statistics: Admitted Patient Care 2015-16, Table 6.43, viewed 13 January 2020 https://www.aihw.gov.au/reports/hospitals/ahs-2015-16-admitted-patient-care/contents/table-of-contents and Australian Institute of Health and Welfare (AIHW) 2016. Australian Hospital Statistics: Admitted Patient Care 2014-15, Table 6.46, viewed 13 January 2020 https://www.aihw.gov.au/reports/hospitals/ahs-2014-15-admitted-patient-care/contents/table-of-contents
- Australian Institute of Health and Welfare (AIHW) 2019. Australian Hospital Statistics: Elective Surgery Waiting Times 2018-19, Tables 4.2, viewed 13 January 2020, https://www.aihw.gov.au/reports-data/myhospitals/sectors/elective-surgery
- Australian Institute of Health and Welfare (AIHW) 2019. Australian Hospital Statistics: Elective Surgery Waiting Times 2018-19, Table 4.10, viewed 13 January 2020, https://www.aihw.gov.au/reports-data/myhospitals/sectors/elective-surgery
- Australian Institute of Health and Welfare (AIHW) 2018. Australian Hospital Statistics: Elective Surgery Waiting Times 2017-18, Table 4.10, viewed 13 January 2020 https://www.aihw.gov.au/reports/hospitals/elective-surgery-waiting-times-2017-18/contents/table-of-contents
- Australian Institute of Health and Welfare (AIHW) 2019. Australian Hospital Statistics: Elective Surgery Waiting Times 2018-19, Table 4.11 to 4.18, viewed 13 January 2020, https://www.aihw.gov.au/reports-data/myhospitals/sectors/elective-surgery
- Australian Institute of Health and Welfare (AIHW) 2019. Australian Hospital Statistics: Elective Surgery Waiting Times 2018-19, Table 2.2, viewed 13 January 2020, https://www.aihw.gov.au/reports-data/myhospitals/sectors/elective-surgery
- AMA Private Health Insurance Report Card 2019 https://ama.com.au/article/ama-private-health-insurance-report-card-2019
- Council on Federal financial Relations (2020) National Health Reform Agreement from 1 July 2020, Schedule J http://www.federalfinancialrelations.gov.a(u/content/national_health_reform.aspx
- Independent Pricing Authority 2020, National Efficient Price 2020-21, p7 https://www.ihpa.gov.au/sites/default/files/publications/national_efficient_price_determination_2020-21.pdf
- Fair Work Commission, ACT Public Service Nursing and Midwifery Enterprise Agreement 2017-2019 [AE503830] http://www.fwc.gov.au/
Fair Work Commission. Northern Territory Public Sector Nurses and Midwives 2018-2022 Enterprise Agreement AE501953, http://www.fwc.gov.au/;
Fair Work Commission. Victoria Nurses and Midwives (Victorian Public Sector (Single Interest Employers) Enterprise Agreement 2016-2020, AE422722, http://www.fwc.gov.au;
Western Australian Industrial Relations Commission at http://www.wairc.wa.gov.au/; SafeWork SA at https://www.safework.sa.gov.au/workers/wages-and-conditions/industrial-relations
Queensland Industrial Relations Commission. Nurses and Midwives (Queensland Health and Department of Education Certified Agreement (EB10) 2018, No. CB/2018/124 at: http://www.qirc.qld.gov.au/;
New South Wales Industrial Relations Commission. IRC 2019/00204542 at: http://www.irc.justice.nsw.gov.au/
Tasmanian Industrial Relations Commission. Nurses and Midwives (Tasmanian State Service Agreement 2018 TI 14676 of 2019 at: https://www.tic.tas.gov.au/
Western Australian Industrial Relations Commission. WA Health system Australian Nursing Federation -Registered Nurses, Midwives, Enrolled (Mental Health) and Enrolled (Mothercraft) Nurses – Industrial Agreement 2018 AG 7 of 2019 http://www.wairc.wa.gov.au/
SafeWork SA. Nursing/Midwifery (South Australian Public Sector) Enterprise Agreement 2016 [File No: 136 of 2017] https://www.safework.sa.gov.au/workers/wages-and-conditions/industrial-relations - Council on Federal financial Relations (2020) National Health Reform Agreement from 1 July 2020, Schedule J p18 http://www.federalfinancialrelations.gov.au/content/npa/health/other/NHRA_2020-25_Addendum_consolidated.pdf
- Council on Federal financial Relations (2020) National Health Reform Agreement from 1 July 2020, Schedule J p58 http://www.federalfinancialrelations.gov.au/content/npa/health/other/NHRA_2020-25_Addendum_consolidated.pdf
- Council on Federal financial Relations (2020) National Health Reform Agreement from 1 July 2020, Schedule J p12 http://www.federalfinancialrelations.gov.au/content/npa/health/other/NHRA_2020-25_Addendum_consolidated.pdf
- Council on Federal financial Relations (2020) National Health Reform Agreement from 1 July 2020, Schedule J p57 http://www.federalfinancialrelations.gov.au/content/npa/health/other/NHRA_2020-25_Addendum_consolidated.pdf
- Australian Institute of Health and Welfare Australian Institute of Health and Welfare (AIHW) 2019, Health and welfare expenditure series: Health expenditure Australia 2017–18, Table 4.3,viewed 27 February 2020 https://www.aihw.gov.au/reports/health-welfare-expenditure/health-expenditure-australia-2017-18/data
- Australian Institute of Health and Welfare Australian Institute of Health and Welfare (AIHW) 2019, Health and welfare expenditure series: Health expenditure Australia 2017–18, Table 4.3,viewed 27 February 2020 https://www.aihw.gov.au/reports/health-welfare-expenditure/health-expenditure-australia-2017-18/data
- Australian Institute of Health and Welfare (AIHW) 2019, Health and welfare expenditure series: Health expenditure Australia 2017–18, Table 4.3,viewed 27 February 2020 https://www.aihw.gov.au/reports/health-welfare-expenditure/health-expenditure-australia-2017-18/data
- Australian Institute of Health and Welfare (AIHW) 2019, Health and welfare expenditure series: Health expenditure Australia 2017–18, Table 4.3,viewed 27 February 2020 https://www.aihw.gov.au/reports/health-welfare-expenditure/health-expenditure-australia-2017-18/data
- Australian Institute of Health and Welfare (AIHW) 2019, Health Expenditure Australia: 2007-08 to 2017-18, viewed 25 February 2020, Health expenditure Australia 2017–18, Data visualisation - Australian Institute of Health and Welfare
- Average annual growth calculations are calculated by the Australian Medical Association.
- Australian Institute of Health and Welfare (AIHW) 2019, Health Expenditure Australia: 2007-08 to 2017-18, viewed 25 February 2020, https://www.aihw.gov.au/reports/health-welfare-expenditure/health-expenditure-australia-2017-18/contents/data-visualisation
- Australian Independent Hospital Pricing Authority 2020, National Hospital Cost Data Collection Report 2017-18, viewed 27 February 2020 https://www.ihpa.gov.au/publications/national-hospital-cost-data-collection-report-public-sector-round-22-financial-year
- Australian Independent Hospital Pricing Authority 2020, National Hospital Cost Data Collection Report 2017-18, viewed 27 February 2020 https://www.ihpa.gov.au/publications/national-hospital-cost-data-collection-report-public-sector-round-22-financial-year
- Independent Hospital Pricing Authority 2020, National Hospital Cost Data Collection Report Round 22, (Financial Year 2017-18),p14 viewed 11 March 2020 https://www.ihpa.gov.au/publications/national-hospital-cost-data-collection-report-public-sector-round-22-financial-year
- Independent Hospital Pricing Authority 2020, National Efficient Price Determination 2020-21, viewed 11 March 2020 https://www.ihpa.gov.au/sites/default/files/publications/national_efficient_price_determination_2020-21.pdf
- Australian Institute of Health and Welfare (AIHW) 2019, Australian hospital statistics: Hospital Resources 2017-18, Table S2.1 Accessed 16 June 2020 https://www.aihw.gov.au/reports/hospitals/hospital-resources-2017-18-ahs/data
- Fair Work Commission. ACT Public Service Nursing and Midwifery Enterprise Agreement 2017-2019 [AE503830] http://www.fwc.gov.au/
Fair Work Commission, Northern Territory Public Sector Nurses and Midwives 2018-2022 Enterprise Agreement AE501953, http://www.fwc.gov.au/
Fair Work Commission, Victoria Nurses and Midwives (Victorian Public Sector (Single Interest Employers) Enterprise Agreement 2016-2020, AE422722, http://www.fwc.gov.au;
Queensland Industrial Relations Commission. Nurses and Midwives (Queensland Health and Department of Education Certified Agreement (EB10) 2018, No. CB/2018/124 http://www.qirc.qld.gov.au/
New South Wales Industrial Relations Commission. IRC 2019/00204542 http://www.irc.justice.nsw.gov.au/
Tasmanian Industrial Relations Commission. Nurses and Midwives (Tasmanian State Service Agreement 2018 TI 14676 of 2019 https://www.tic.tas.gov.au/
Western Australian Industrial Relations Commission. WA Health system Australian Nursing Federation -Registered Nurses, Midwives, Enrolled (Mental Health) and Enrolled (Mothercraft) Nurses – Industrial Agreement 2018 AG 7 of 2019 http://www.wairc.wa.gov.au/
SafeWork SA. Nursing/Midwifery (South Australian Public Sector) Enterprise Agreement 2016 [File No: 136 of 2017] https://www.safework.sa.gov.au/workers/wages-and-conditions/industrial-relations