2024 Public hospital report card - mental health
edition
State by state public hospital performance - Western Australia
Mental health capacity in public hospitals
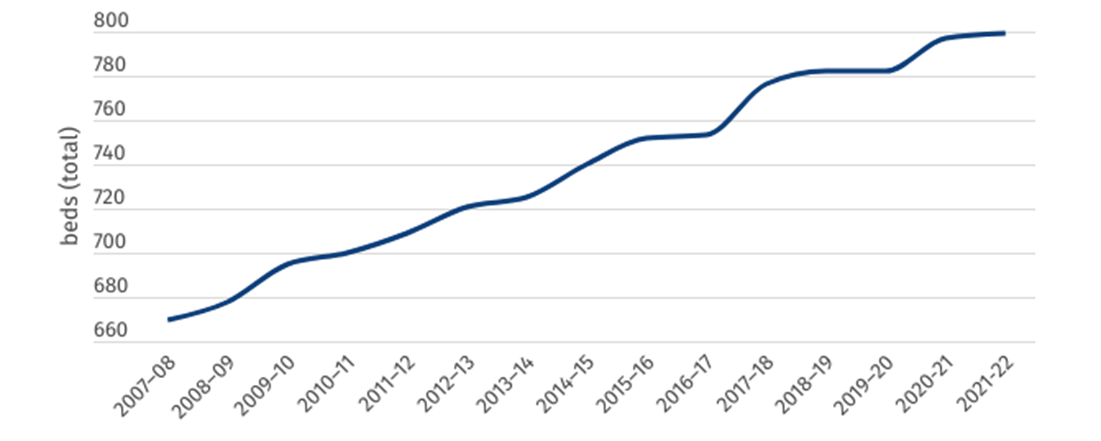
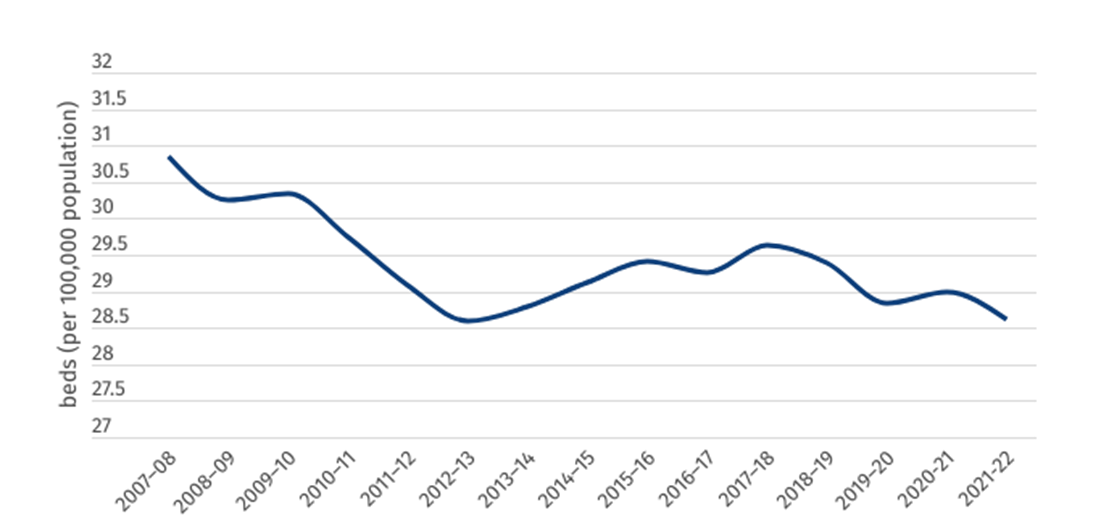
WA has been consistently increasing the number of specialised mental health public hospital beds for the past 10 years, with the total number of public sector specialised mental health hospital beds increasing from 670 to 799 since 2007–08. However, this increase has been not kept up with the pace of an increasing population, with the number of mental health beds available per 100,000 West Australians falling from 30.9 to 28.6 over the same period.
Consistent with most states, these graphs highlight the importance of investing into the capacity of our mental health public hospital system at a rate sufficient to cope with population growth.
Figure 1: Total number of specialised mental health public hospital beds (WA)
Figure 2: Specialised mental health public hospital beds per 100,000 population (WA)
Mental Health Presentations to ED
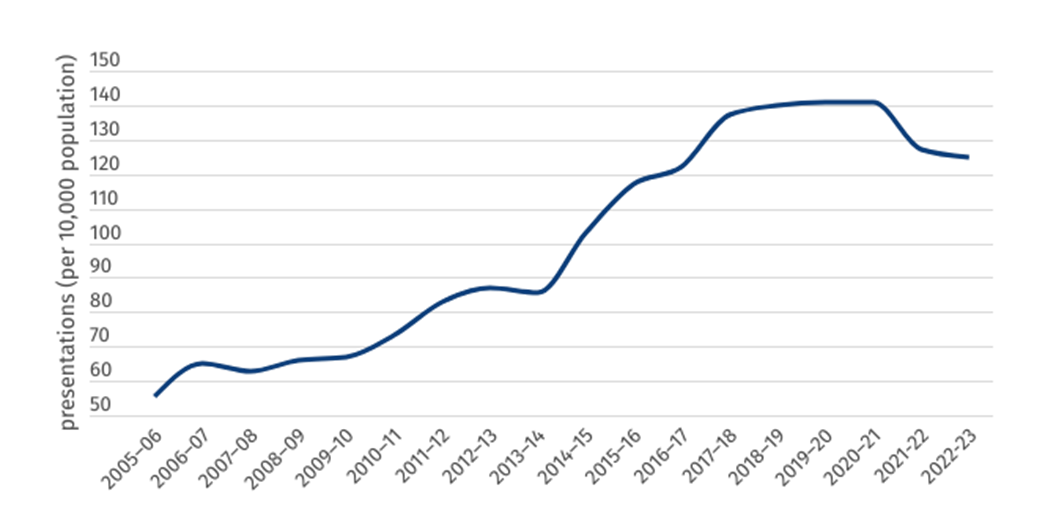
Despite falling for the past three years, the per-person rate of mental health presentations to Western Australian emergency departments has seen a worrying and consistent rise for the past twenty years. Where WA had the lowest rate of mental health presentations of any state in 2004-5 at 50.7 per 10,000, this has risen by almost 250 per cent in twenty years. At 125 presentations per 10k in 2022-23, Western Australians are presenting to ED with a mental health illness at the third highest rate in the country, signalling a concerning rise in unmet mental illness within the Western Australian population.
Figure 3; Rate of ED mental health presentations per 10,000 population (WA)
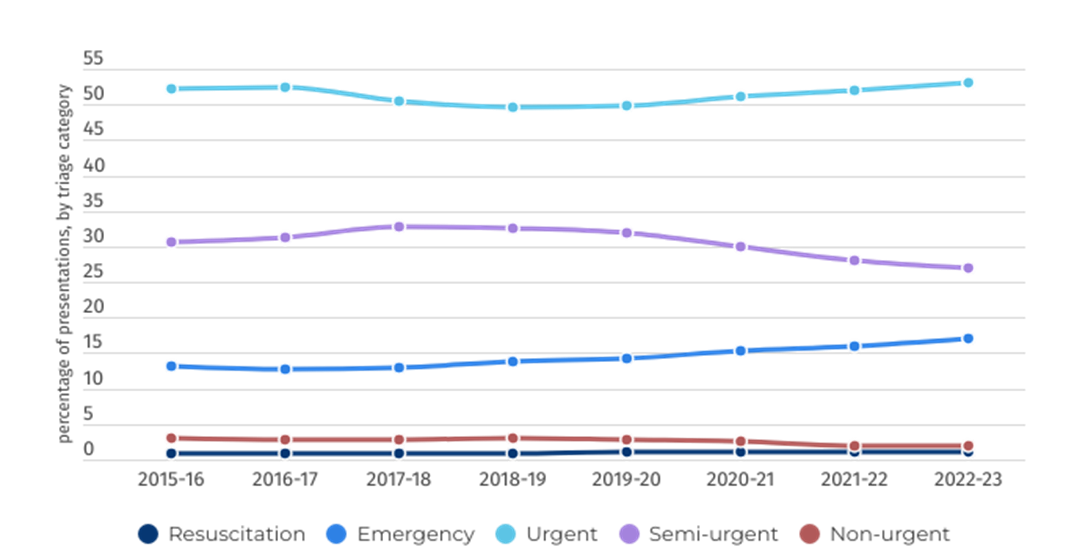
Figure 4: Mental health-related ED presentations, by triage category, per cent (WA)
Length of stay
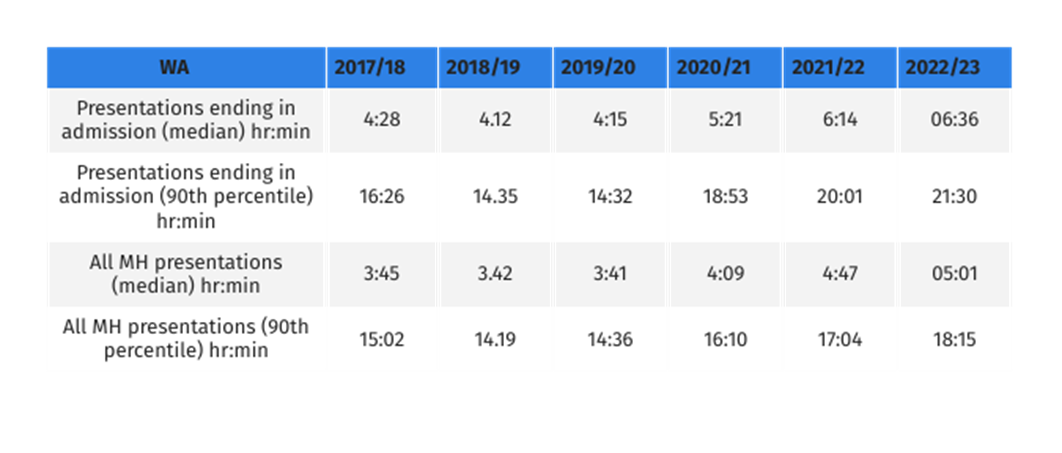
This page demonstrates the length of stay for mental health patients across two areas of the public hospital — the emergency department and inpatient beds once admitted to hospital.
Mirroring national trends, Western Australia has seen a worrying and consistent increase in the median time spent in emergency departments. Patients who are eventually admitted to hospital are spending, on average, more than two hours longer in emergency departments than they were just five years prior. Ten percent of patients now wait 19 hours in an overcrowded and stressful ED due to under capacity and poorly resourced hospitals.
Figure 5: Length of stay in ED (WA)
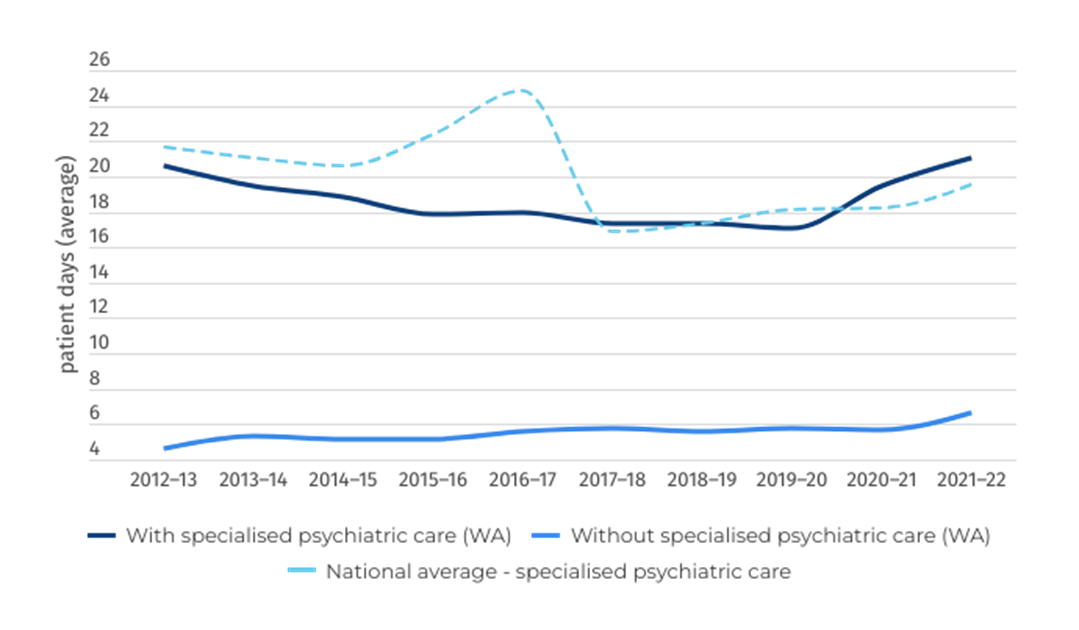
Figure 6: Overnight admitted care length of stay (days) (WA)
Clinical outcomes
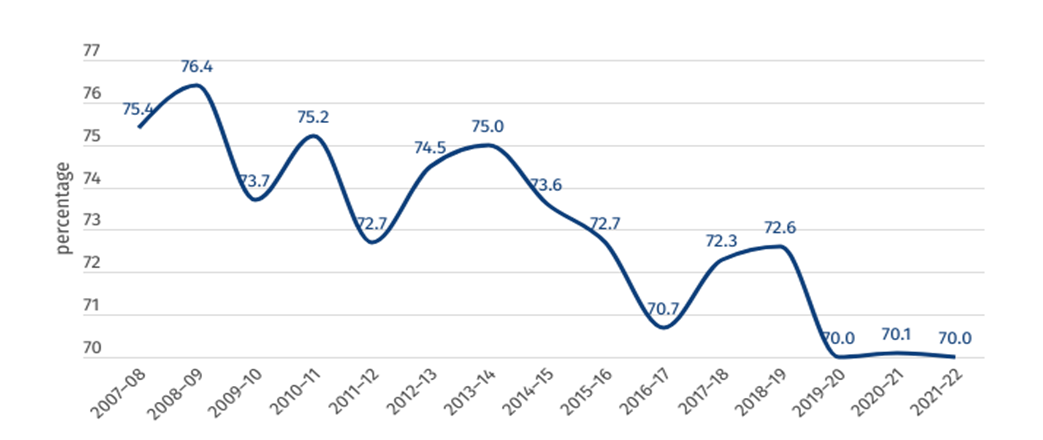
Figure 7 shows the percentage of mental health inpatients who saw a significant improvement to their clinical outcome according to the National Outcomes and Casemix Collection (NOCC). While these figures should not be compared across jurisdictions, 70 per cent of mental health-related public hospital inpatients surveyed saw a significant improvement as a result of their treatment in 2021–22 across Western Australia, the equal lowest result in the past 15 years.
Figure 7: Clinical outcome of people receiving mental healthcare in hospital (percentage who saw a significant improvement)
Community follow-up
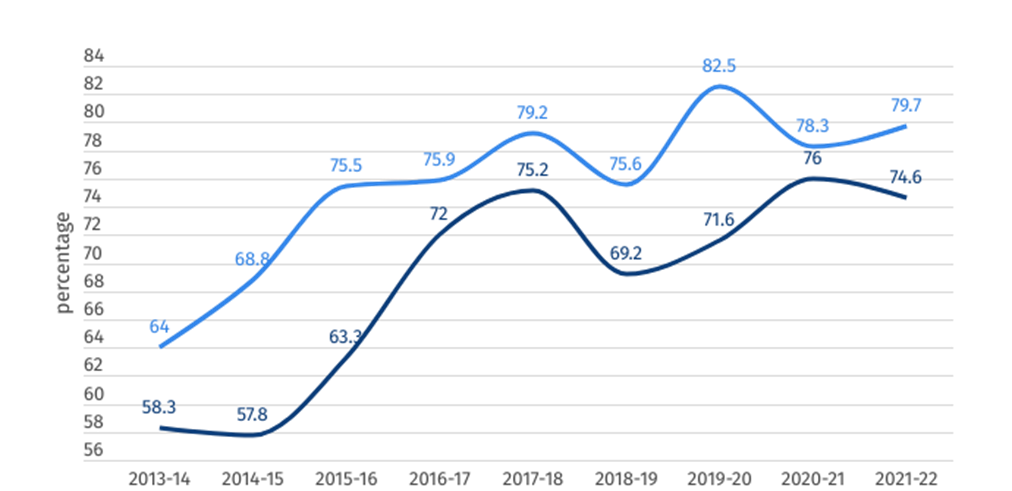
Community follow-up after psychiatric admission/hospitalisation is defined as the proportion of state and territory governments’ specialised public admitted patient overnight acute separations from psychiatric units for which a community-based ambulatory contact was recorded in the seven days following separation.
Figure 8: Rate of community follow-up within 7 days of discharge from a psychiatric admission