2024 Public hospital report card - mental health
edition
State by state public hospital performance - Tasmania
Mental health capacity in public hospitals
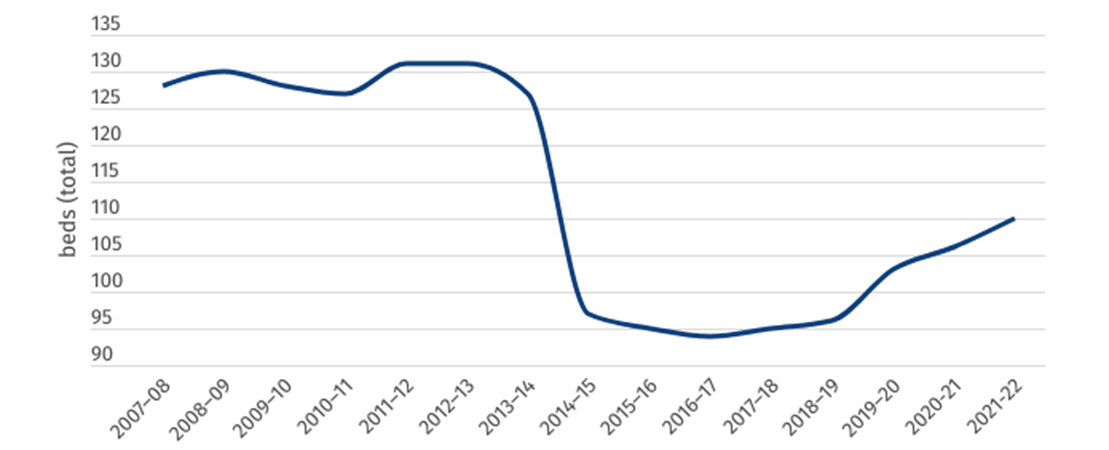
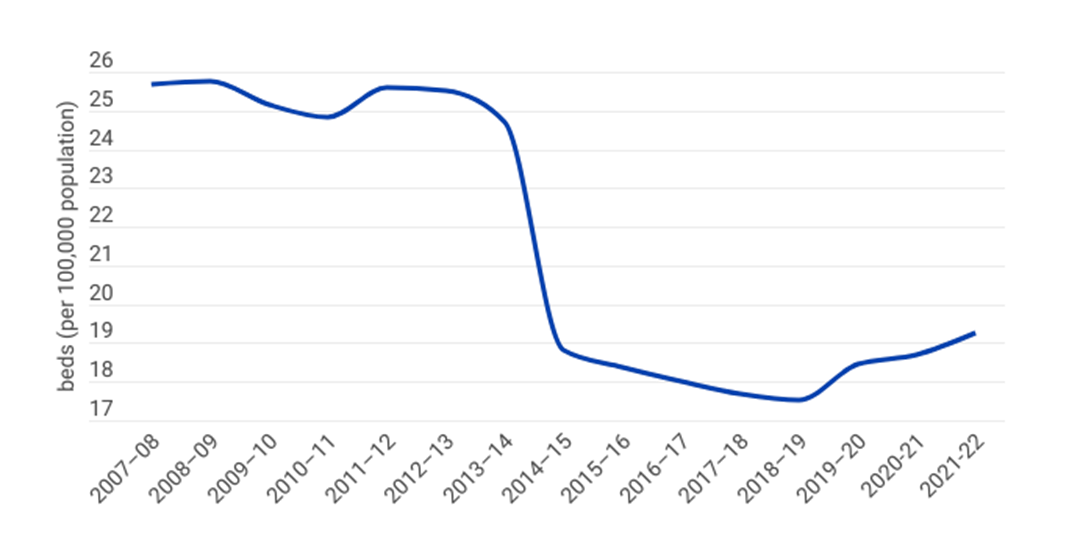
Despite an increase of 4 specialised mental health beds in 2021–22, Tasmania retains the second worst per-person capacity for public mental health beds in Australia, with only 19 beds per 100,000 people. A drastic reduction in beds between 2013–14 and 2014–15 has likely contributed to Tasmania’s worst-on-record time spent in emergency departments, with the average patient having to wait more than 12 hours in an overcrowded ED before receiving the inpatient hospital bed they so desperately need.
Figure 1: Total number of specialised mental health public hospital beds (Tas)
Figure 2: Specialised mental health public hospital beds per 100,000 population (Tas)
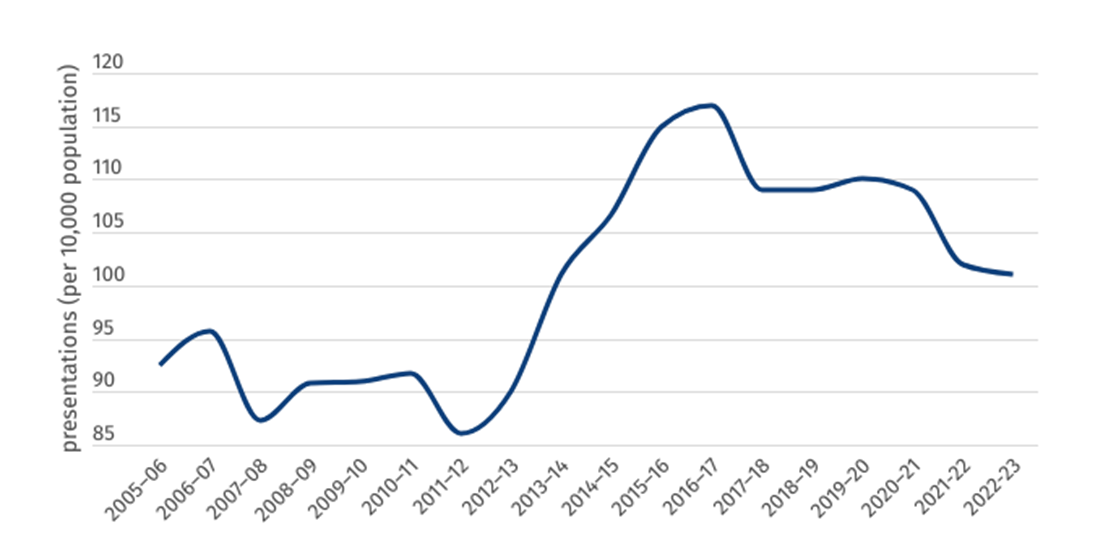
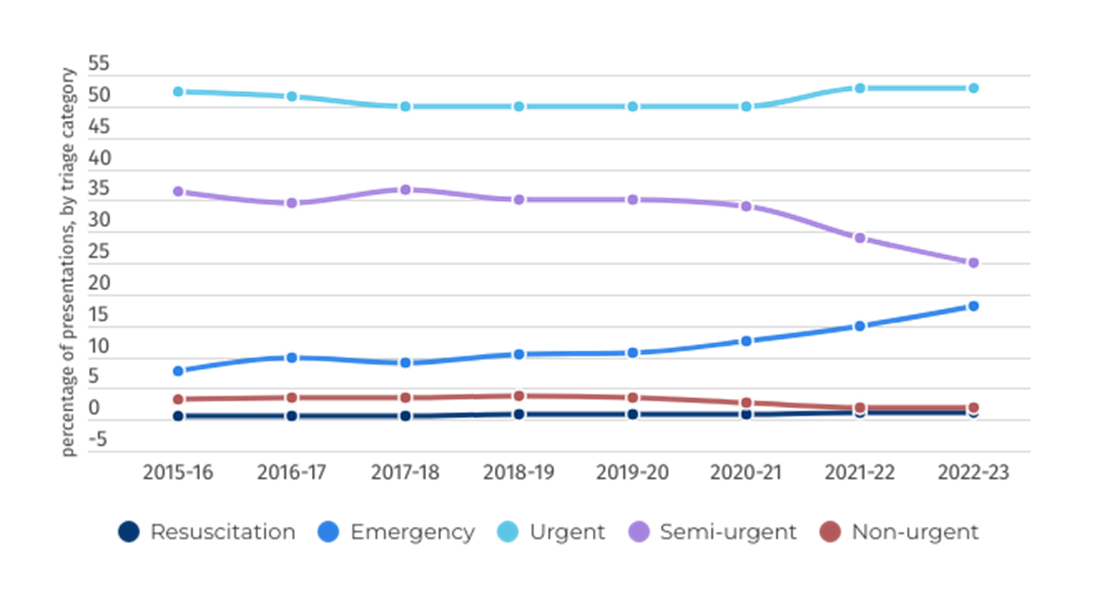
The number of per-person mental health-related presentations has been falling for the past six years in Tasmania, from 115 in 2015–16 to 101 in 2022–23. While this is a positive sign, the share of mental health patients presenting to ED who are triaged as “emergency” (to be seen in under 10 minutes) has been rising, from 7.7 per cent of all presentations in 2015–16 to 18 per cent in 2022–23, highlighting an increase in severity of mental illness within the Tasmanian community.
Figure 3: Rate of ED mental health presentations per 10,000 population
Figure 4: Mental health-related ED presentations, by triage category, per cent
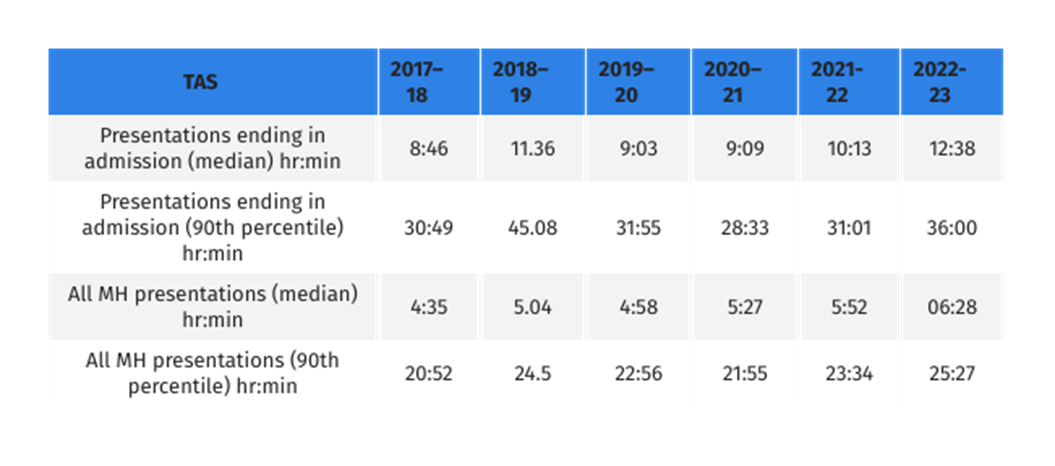
Length of stay
This page demonstrates the length of stay for mental health patients across two areas of the public hospital — the emergency department and inpatient beds once admitted to hospital.
The worst performing jurisdiction in this category, Tasmania has gone from bad to worse when it comes to median time spent in emergency departments. Patients who are eventually admitted to hospital are spending, on average, more than 12.5 hours in the emergency departments before they receive a hospital bed. Ten per cent of patients now wait more than 36 hours, or a day and a half, in an overcrowded and stressful ED due to under capacity and poorly resourced hospitals.
These are extremely concerning figures and point to the urgent need for increased capacity to address bed block within Tasmania’s public hospitals.
Figure 5: Length of stay in ED
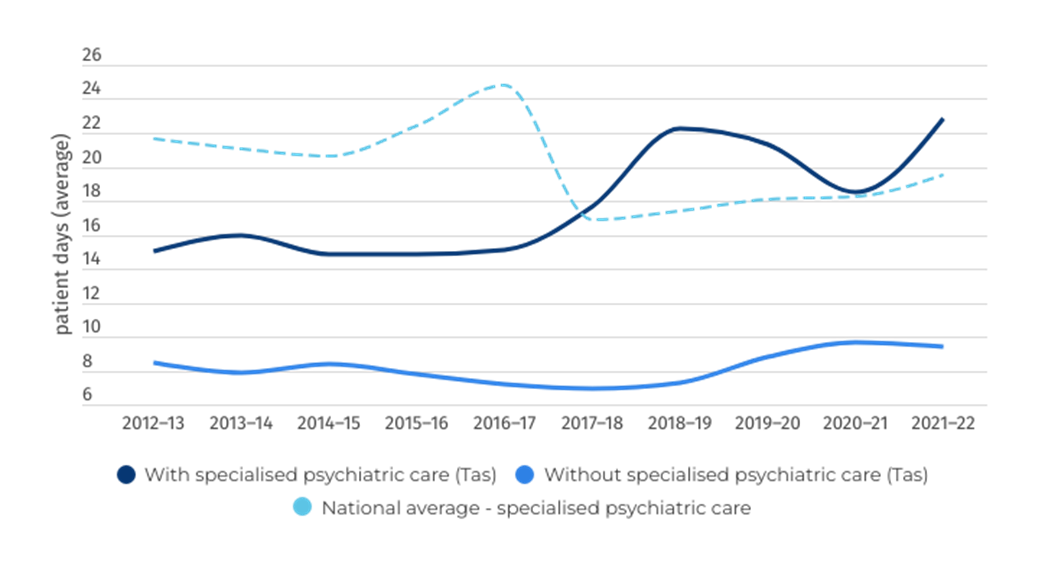
Figure 6: Overnight admitted care length of stay (days)
Clinical outcomes
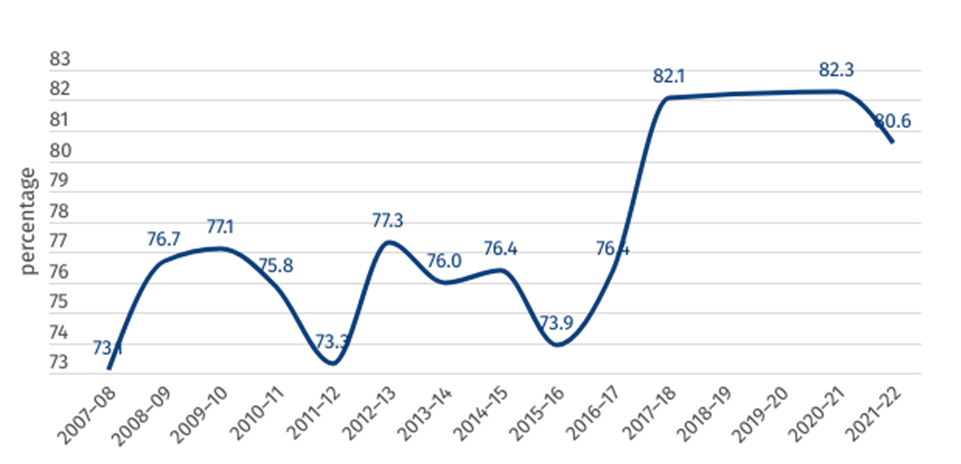
Figure 7 shows the percentage of mental health inpatients who saw a significant improvement to their clinical outcome according to the National Outcomes and Casemix Collection (NOCC). While these figures should not be compared across jurisdictions, 80.6 per cent of mental health-related public hospital inpatients surveyed saw a significant improvement as a result of their treatment in 2021–22 across Tasmania. Note that data was missing for 2018–19 and 2019–20.
Figure 7: Clinical outcome of people receiving mental healthcare in hospital (percentage who saw a significant improvement)
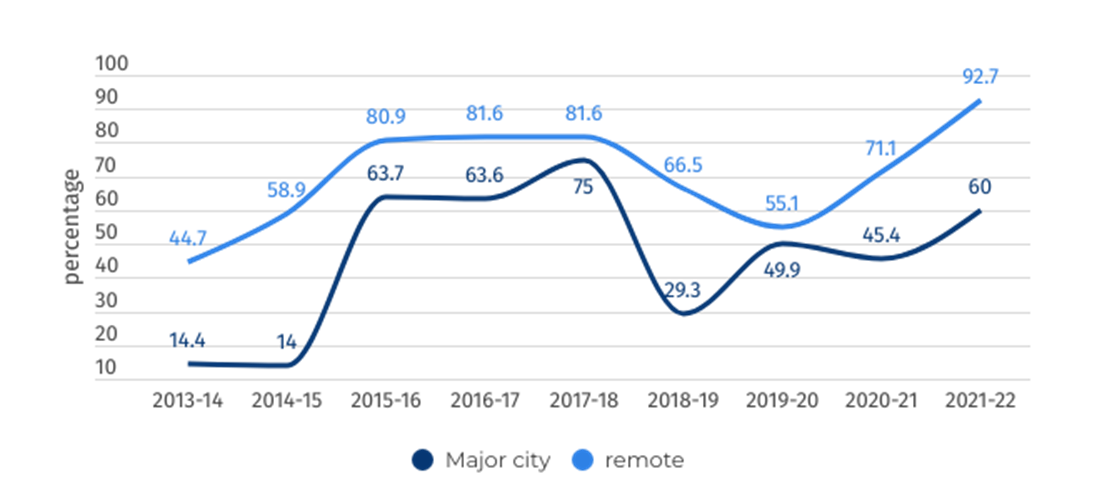
Community follow-up
Community follow-up after psychiatric admission/hospitalisation is defined as the proportion of state and territory governments’ specialised public admitted patient overnight acute separations from psychiatric units for which a community-based ambulatory contact was recorded in the seven days following separation.
Figure 8: Rate of community follow-up within 7 days of discharge from a psychiatric admission