Mental health capacity in public hospitals
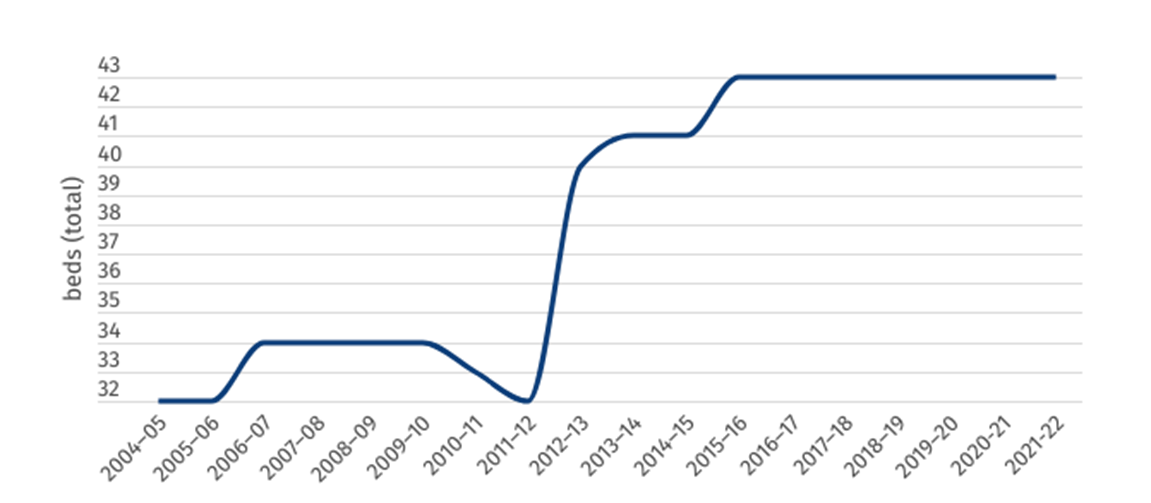
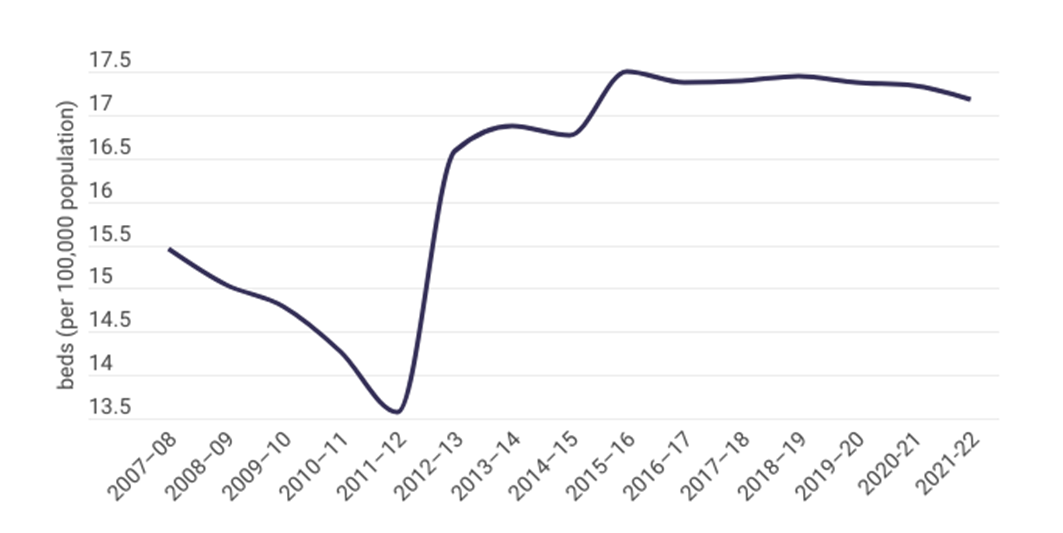
The Northern Territory has maintained the same number of specialised mental health beds for the past seven years, translating to a very minor reduction in per-person capacity as the population has grown slightly.
The figure of 17 metal health beds per 100,000 population sits well below the national average of 27 beds per 100,000