2024 Public hospital report card - mental health
edition
State by state public hospital performance - New South Wales
Mental health capacity in public hospitals
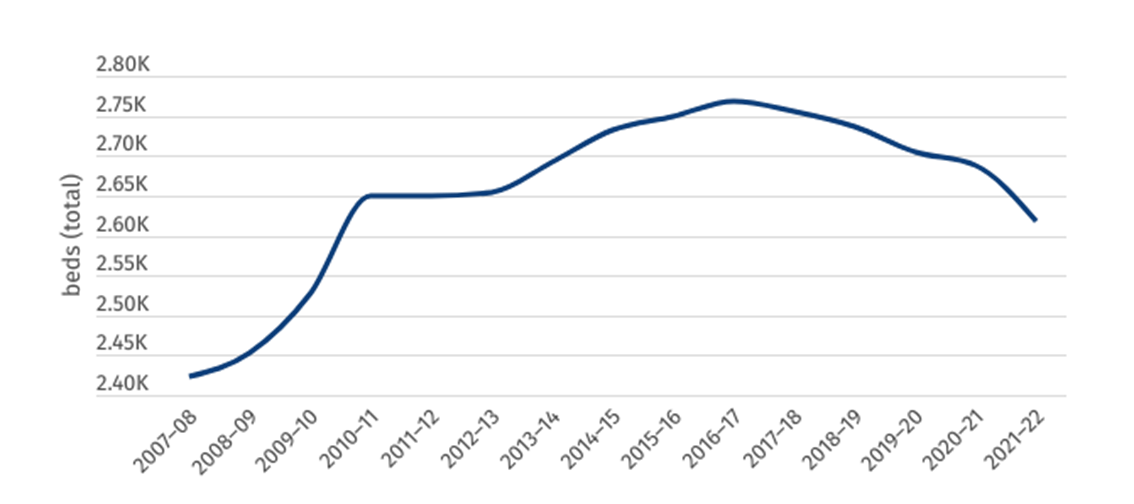
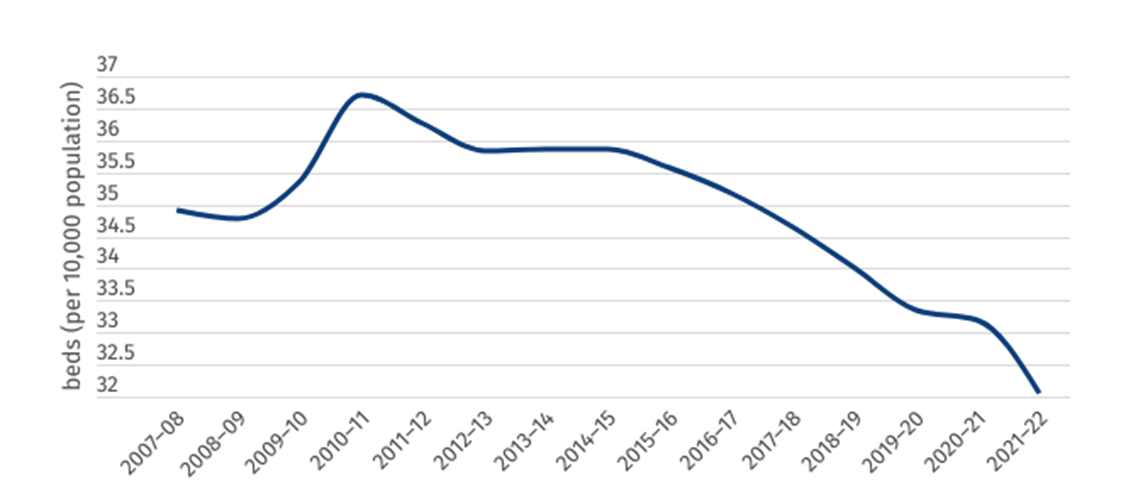
New South Wales (NSW) has witnessed a notable fall in mental health capacity in public hospitals, both in real and per-person terms. In the five-year period between 2016–17 and 2021–22, the total number of specialised public mental health beds has fallen from 2768 to 2618, a reduction in 150 beds. When accounting for population growth, the fall is even greater, with the number of beds per-person falling from 35.2 to 32.1 over the same period.
Figure 1: Total number of specialised mental health public hospital beds (NSW)
Figure 2: Specialised mental health public hospital beds per 100,000 population (NSW)
Mental health presentations to ED
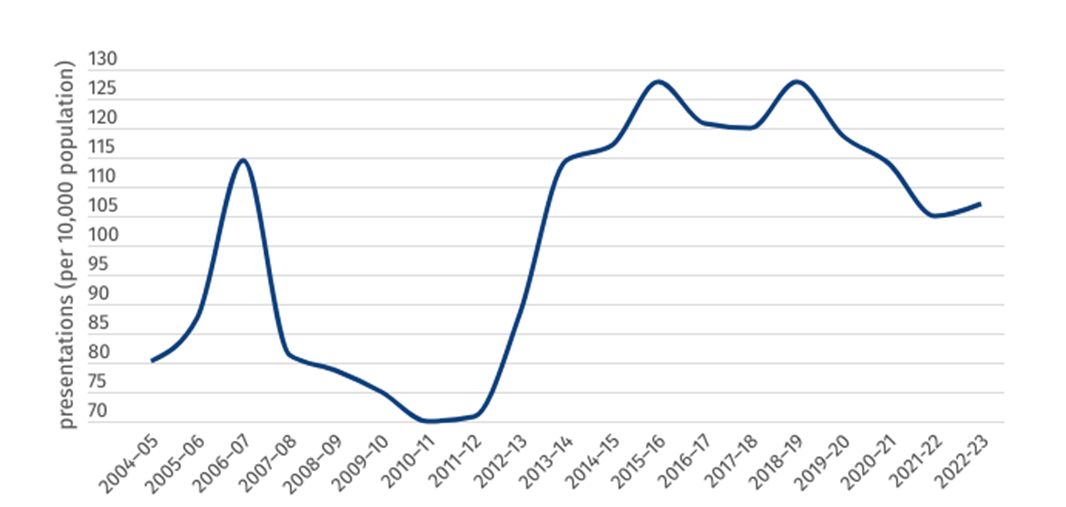
The number of per-population mental health presentations rose slightly in 2022–23, from 105 per 10,000 to 107 per 10,000 in NSW. While it is positive to see the number of people presenting to ED with mental health illness has fallen since the peak in 2018–19, the severity of cases continues to rise.
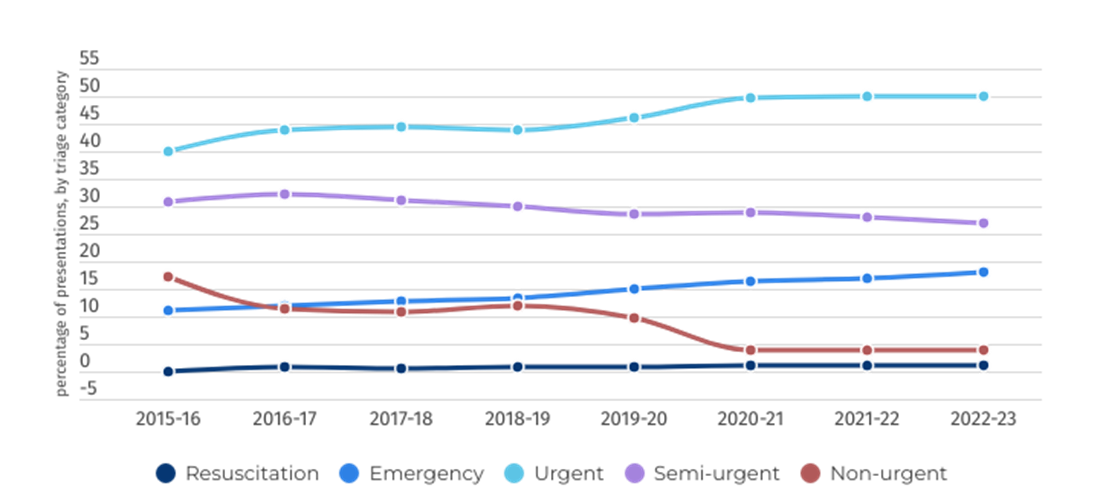
As shown in figure 4, the most frequent triage category for patients presenting to hospital with a mental health condition remains triage category 3, “urgent”, meaning the patient should be seen within 30 minutes. Urgent cases have risen from a 40 per cent share of total mental health-related ED presentations to 50 percent since 2015-16, while “emergency” (within 10 minutes) has risen from 11 per cent to 18 per cent over the same time period.
Figure 3: Rate of ED mental health presentations per 10,000 population (NSW)
Figure 4: Mental health-related ED presentations, by triage category, per cent (NSW)
Length of stay
This page demonstrates the length of stay for Mental Health patients across two areas of the Public Hospital — the emergency department and inpatient beds once admitted to hospital.
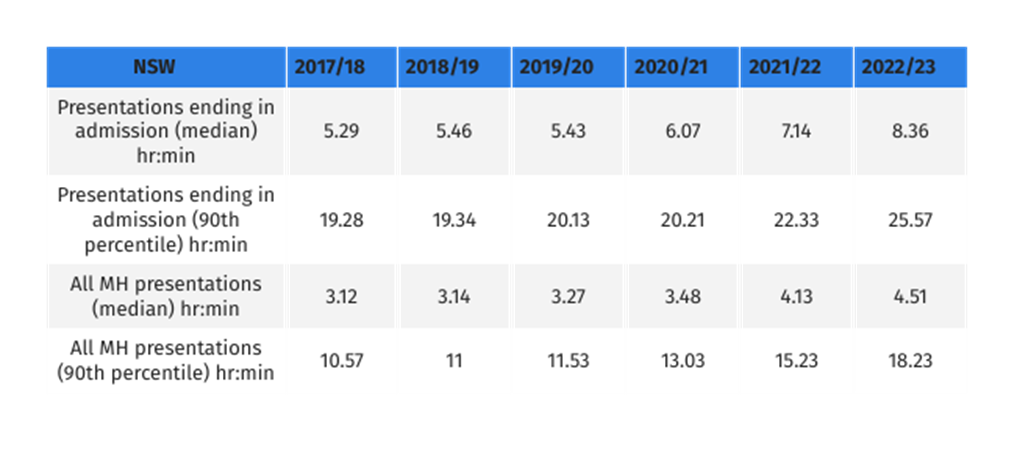
Mirroring national trends, NSW has seen a worrying and consistent increase in the median time spent in emergency departments. Patients who are eventually admitted to hospital are spending, on average, three hours longer in emergency departments than they were just five years prior. Ten per cent of patients now wait more than an entire day in an overcrowded and stressful ED due to under capacity and poorly resourced hospitals.
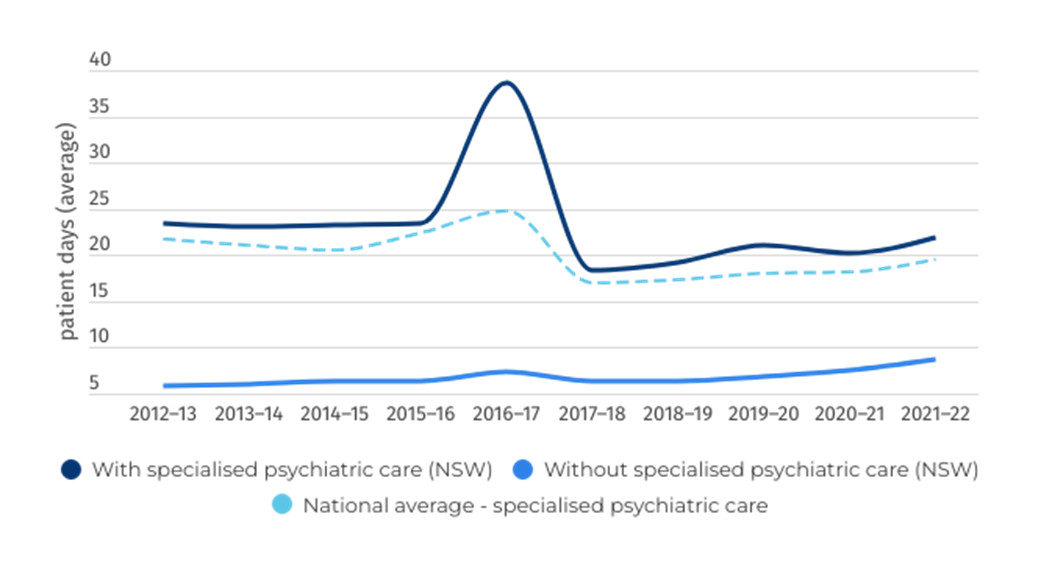
Figure 6 shows the average length of stay for admitted overnight mental health patients receiving specialised psychiatric care is above the national average, at 21.85 days in 2021–22.
Figure 5: Length of Stay in ED (NSW)
Figure 6: Overnight admitted care length of stay – days (NSW)
Clinical outcomes
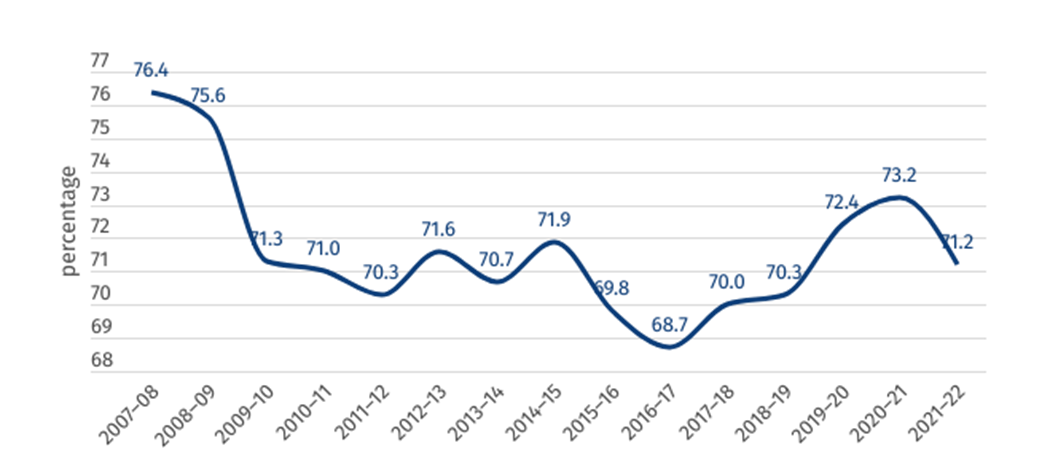
Figure 7 shows the percentage of mental health inpatients who saw a significant improvement to their clinical outcome according to the National Outcomes and Casemix Collection (NOCC). While these figures should not be compared across jurisdictions, 71.2 per cent of mental health-related public hospital inpatients surveyed saw a significant improvement as a result of their treatment in 2021–22 across NSW, a figure that has remained largely steady for the past 10 years.
Figure 7: Clinical outcome of people receiving mental healthcare in hospital (percentage who saw a significant improvement) (NSW)
Community follow-up
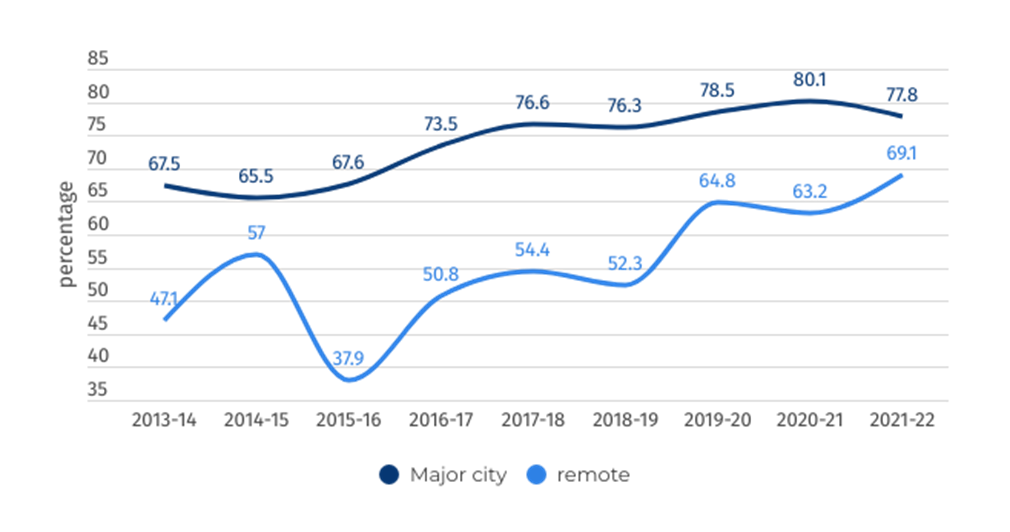
Community follow-up after psychiatric admission/hospitalisation is defined as the proportion of state and territory governments’ specialised public admitted patient overnight acute separations from psychiatric units for which a community-based ambulatory contact was recorded in the seven days following separation. NSW has seen a strong improvement in this category across the past 10 years.
Figure 8: Rate of community follow up within 7 days of discharge from a psychiatric admission (NSW)