2024 Public hospital report card - mental health
edition
National overview
Public hospital capacity - Mental Health Care
An available bed is the most fundamental prerequisite to receiving care in a public hospital. Although the number of hospital beds is not necessarily an indication of the quality of mental healthcare provided, it is an indicator of the capacity of the system to provide acute care for those patients who need it.
In 2021–22, there were 158 public hospitals providing specialised mental health services, two less than there was in 2020–21. These facilities are made up of 19 public psychiatric hospitals and 139 public acute hospitals with a specialised psychiatric unit or ward. A total of 6849 specialised mental health beds were available in 2021–22 (equating to 27 beds per 100,000), a decrease of 244 beds compared to the year prior.
Australia has been witnessing a long-term decline in the number of mental health beds available per person for the past 30 years. The latest figure of 27 beds per 100,000 Australians is the lowest per-person capacity figure on record, highlighting a worrying trend of reduced system capacity at a time when the need for care is greater than ever.
Figure 1: Public sector specialised mental health beds per 100,000 Australians
Note this graph does not include the large decline in bed numbers in the early 1990s brought about due to deinstitutionalisation of mental healthcare. While this type of deinstitutionalisation of mental healthcare was largely necessary at the time, a lack of investment in community services has failed to effectively support those suffering from mental health problems.
Emergency department presentations — mental health
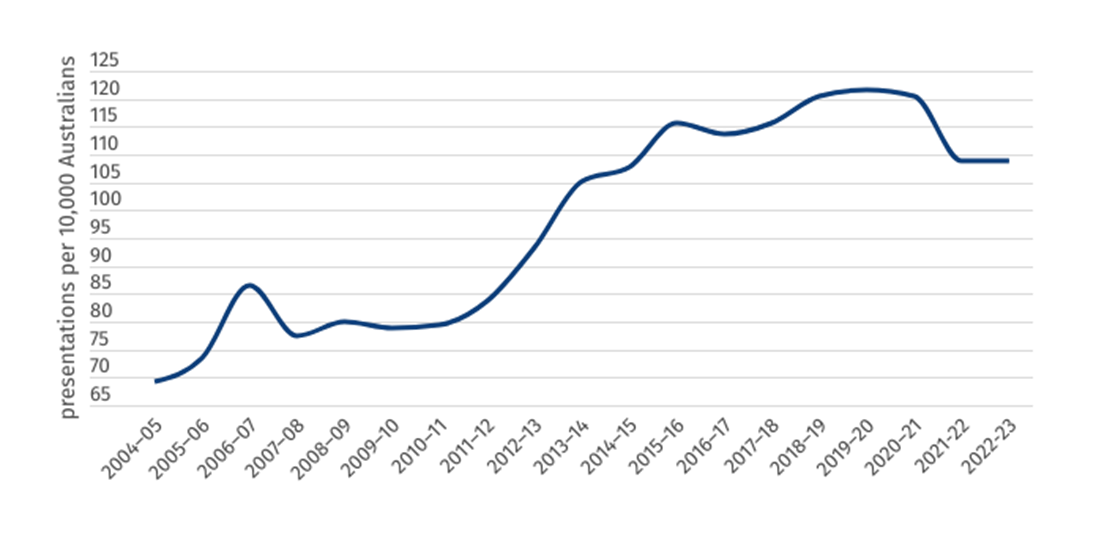
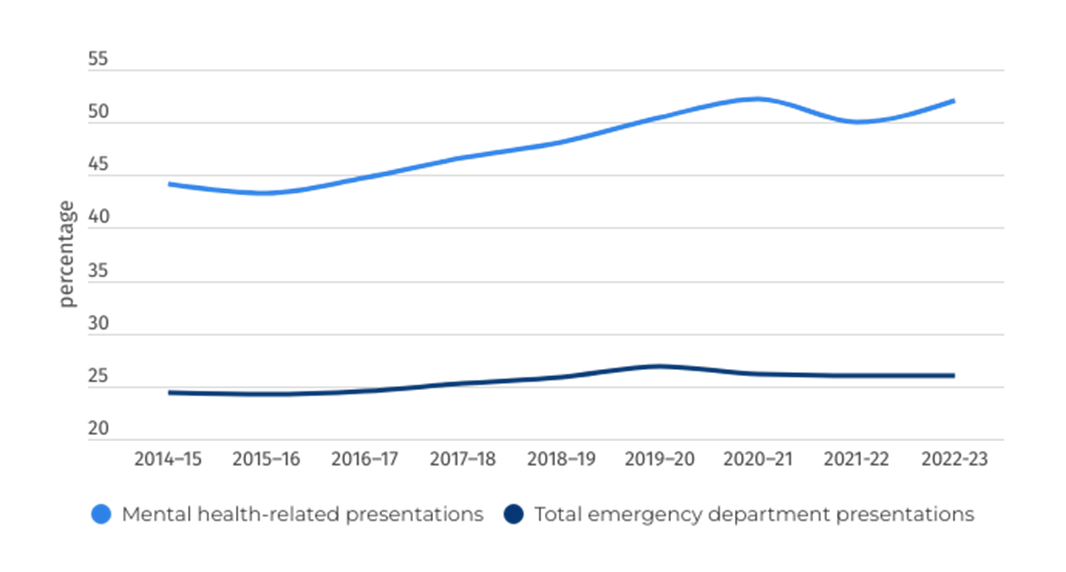
Despite a fall in per-population capacity, the number of per-population mental health-related presentations to the emergency department has remained much higher over the previous decade than the average trend during the early 2000s. Figure 2 not only demonstrates the long-term increase in serious conditions and mental health challenges being unmet by out-of-hospital services, it also shows the need for greater investment in the specialised mental health services within our public hospitals.
Figure 2: Mental health-related presentations to emergency departments, per 10,000 population
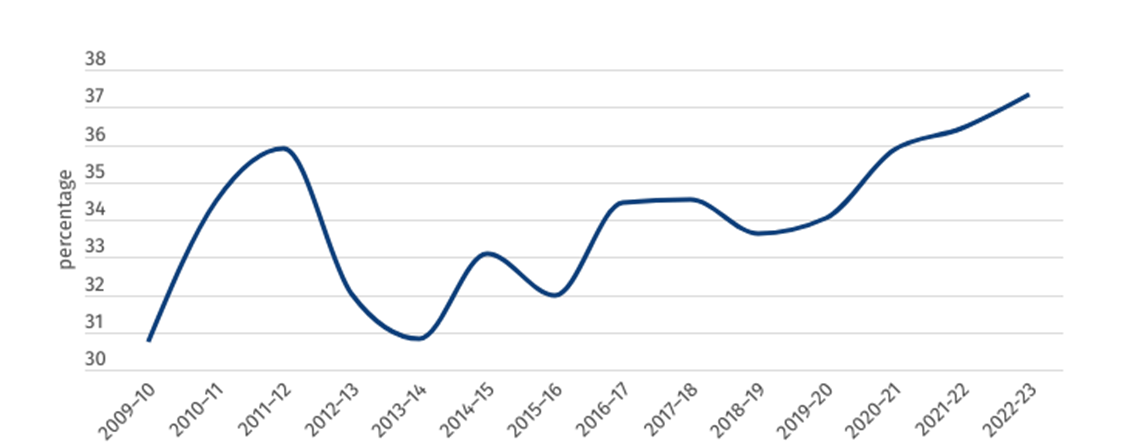
As demonstrated by figure 3, the percentage of patients presenting to the emergency department for mental health reasons who are then admitted to an inpatient bed has risen from 32 per cent to 37 per cent over the past decade, highlighting an increase in severity of cases and demand for inpatient services.
Figure 3: Percentage of mental health-related presentations to ED ending in admission
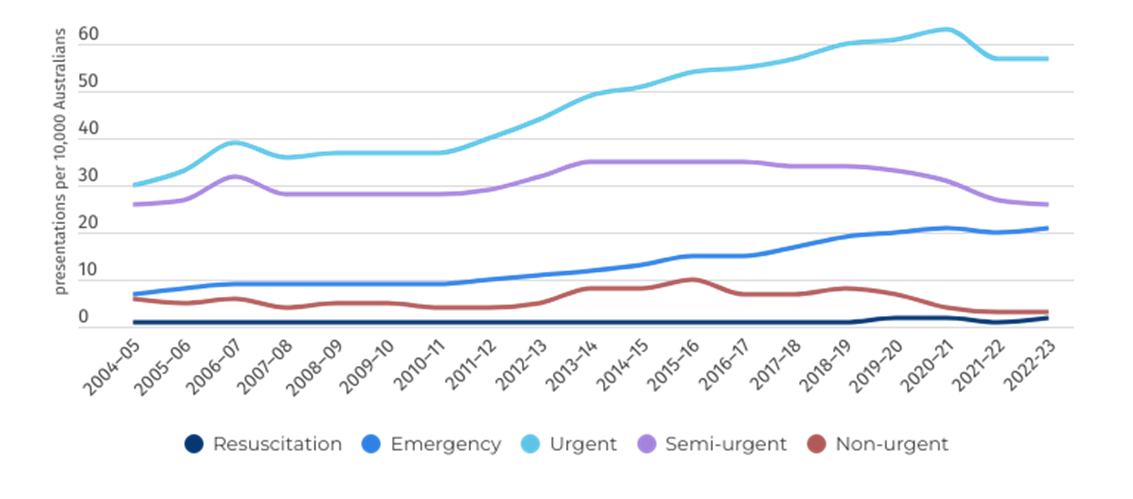
Concerningly, the data also shows an increase in severity of illness for patients presenting to the ED. Since 2010-11, the number of Australians presenting to ED with a mental illness triaged as “emergency” has more than doubled from 9 to 21 per 10,000 people, while the number of “urgent” presentations has grown from 37 to 57 per 10,000 people.
Figure 4: Mental health-related presentations to emergency departments, per 10,000 population, by triage category
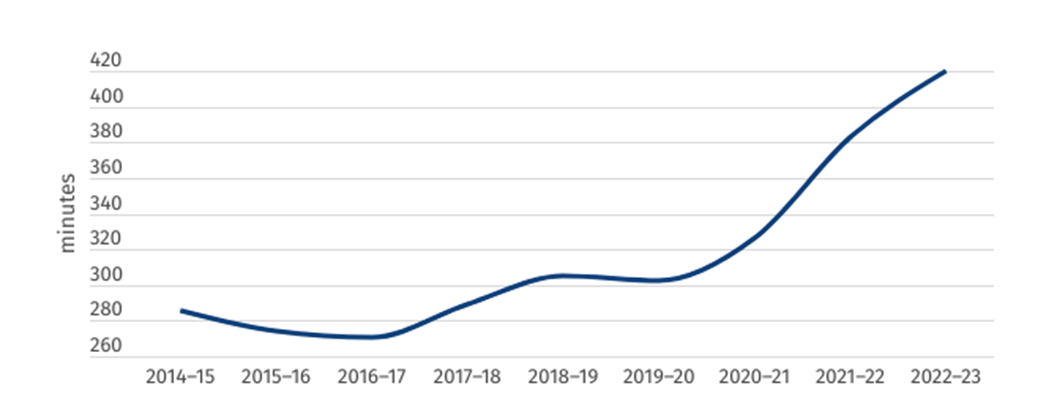
Post presentation and initiation of first-line care in the emergency department, these patients are facing record wait times to be admitted and access the specialised care they require. In 2022–23 the average length of stay in the emergency department for patients who were then admitted to the hospital was 420 minutes, an increase of 37 minutes from the year prior, and two hours longer than 2019–20.
Figure 5: Median length of stay in ED for admitted mental healthcare patients (minutes)
Despite the best efforts of hospital staff, a lack of inpatient beds and insufficient resourcing continues to create access block within our public hospitals. This means highly distressed patients suffering from severe mental health problems must wait, on average, seven hours in a crowded emergency department before they are admitted to a hospital inpatient bed.
Nationally, the 90th percentile length of stay for mental health presentation admissions has risen to 1392 minutes, or more than 23 hours. In other words, more than 10 per cent of mental health patients who are eventually admitted to hospital are waiting almost an entire day in ED.
Emergency department presentations — mode of arrival
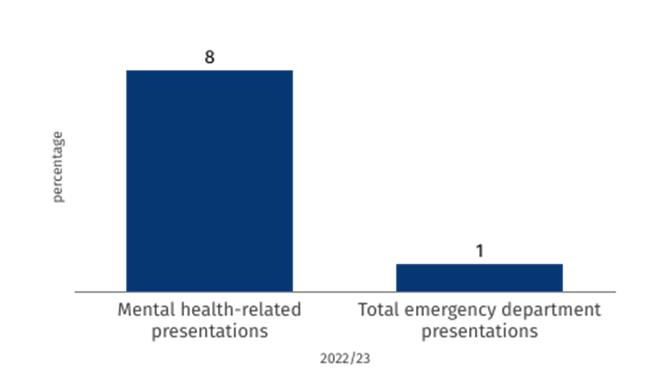
People with mental health conditions disproportionally present to the emergency department via ambulances, helicopters and police vehicles in comparison to non-mental health-related presentations. In 2022–23, more than half (52 per cent) of mental health-related presentations came via an emergency service vehicle, while this number was 26 per cent for all emergency department presentations.
Figure 6: Percentage of emergency department presentations by Ambulance, air ambulance, or helicopter rescue service
Figures 6 and 7 highlight not only the increase in severity and complexity of mental health presentations, but the lack of access and availability of care in the community. Unfortunately, most mental health-related presentations come at a time of acute crisis. Rather than being guided towards the emergency department by a GP, support service, friends or family, it is more often the case that an ambulance or police vehicle is called as a last resort.
Figure 7: Percentage of emergency department presentations to public hospitals by police/correctional services vehicle — 2022/23
Overnight admitted mental health care
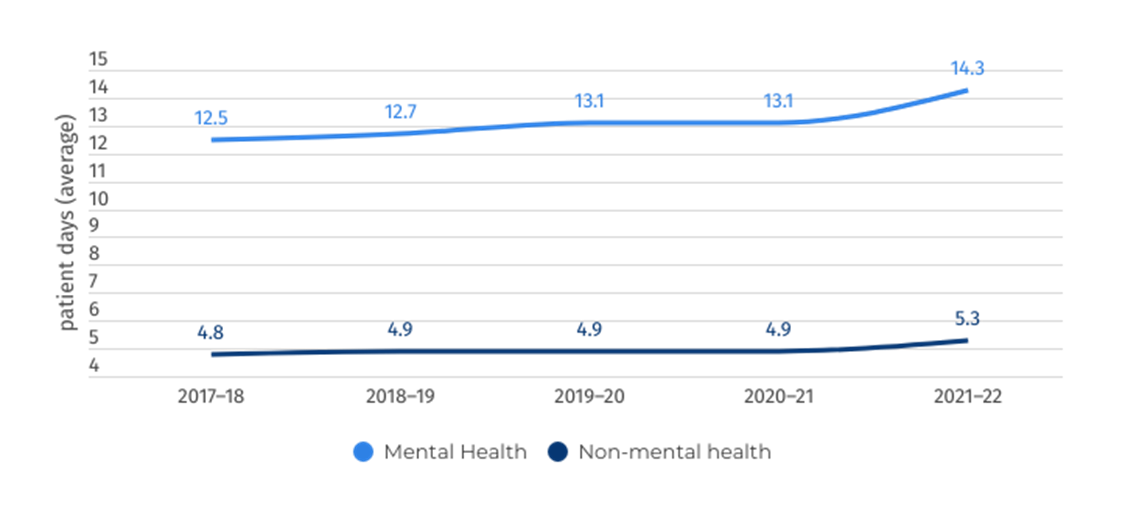
Mental health patients typically remain in hospital for longer than non-mental health patients due to the complexity and fragility of their health at the point of admission. In 2022–23, the average length of stay for mental health patients was 14.3 days, compared to 5.3 days for non-mental health admissions.
Figure 8: Average number of patient days per admission
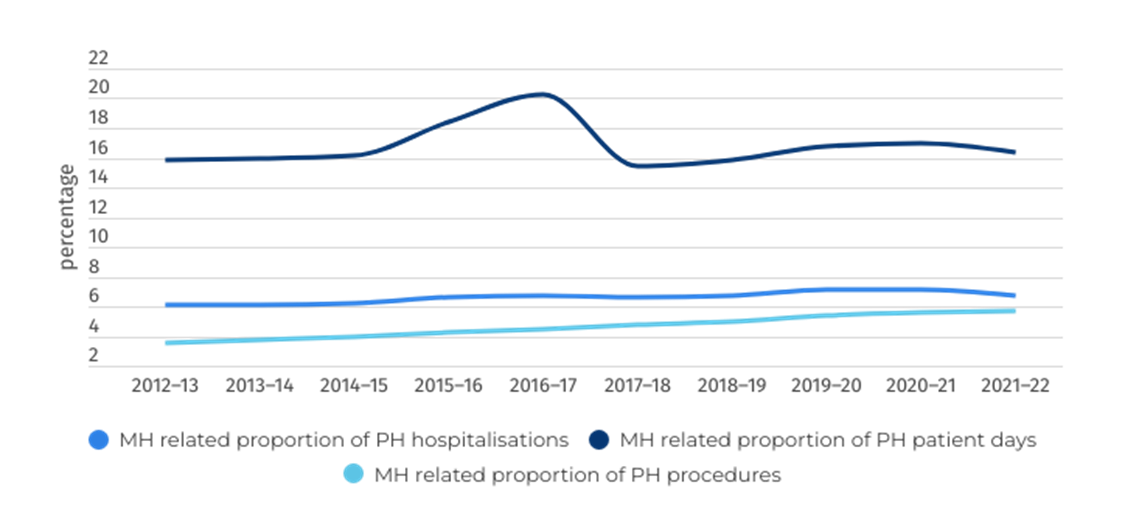
Overall, as demonstrated by figures 8 and 9, mental health patients occupy a disproportionate amount of patient days in the public hospital system due to a heightened complexity of needs. This fact, paired with the increasing number of people presenting to ED with mental health-related illness, points to the dire need for added investment in both community supports and hospital capacity to cope with projected demand into the future for both child and youth mental health has well as adult patients.
Figure 9: Mental health activity as a proportion of total activity
While quantifying the complex objectives of healthcare should be approached with caution, numerous metrics are available to help assess whether a patient’s stay in a specialised mental health bed was successful.
One useful performance metric is the National Outcomes and Casemix Collection (NOCC), which comprises a set of outcomes and casemix measures that focus on gathering information about a consumer's clinical status and functioning at various points during their engagement with a mental health service. The NOCC comprises both clinician-rated measures and consumer-rated measures.
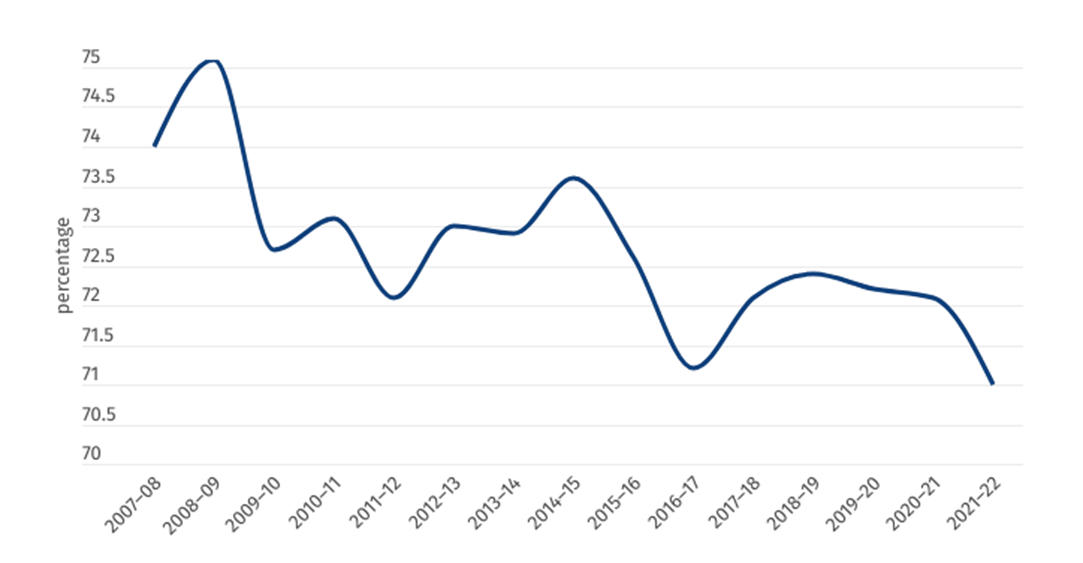
Figure 10: Percentage of admitted mental health patients who saw a significant improvement due to public hospital care
In 2021–22, 71 per cent of patients who had completed inpatient treatment within an Australian public hospital saw a “significant improvement” to their health. Despite remaining relatively stable, this is the lowest figure recorded in the past 15 years, pointing to increasing complexity of mental health problems and negative impact of immense pressure being placed on our public hospital system in delivering high-quality care.
National public hospital performance
Community follow-up
Health doesn’t operate in silos. However, a fragmented healthcare system can lead to poor outcomes for patients, as different disciplines within a single healthcare system (primary through to tertiary) can operate in the absence of accurate and effective data sharing and handover. An essential aspect of cross-system collaboration is the assurance of community follow-up services for patients who have been admitted to hospital for a mental health reason.
Patients can be particularly vulnerable in the post-discharge period, with the likelihood of readmission or relapse greatly reduced if patients are provided with community care in the aftermath of a hospital stay. Across Australia, the rate of patients being provided with community follow-up care has been increasing in both major cities and remote areas. This is a very positive sign, one which is likely to significantly improve the outcomes of Australians who have presented to hospital for mental health reasons.
Figure 11: Percentage of patients who received community follow-up services within 7 days after a psychiatric admission to public hospital
Note that the nation-wide figure for this metric includes only available data, with some states and territories missing during different years throughout the reporting period.
Demographic challenges
Australia’s health system, like most OECD countries, is facing the challenge of an increasingly aging population. According to ABS data, Australians over 65 represented 17.1 per cent of Australia’s total population in 2022 (compared to 15.9 per cent in 2019). This portion of our population represented more than 40 per cent of total separations from public hospitals in 2021–22 and 47 per cent of the total patient days occupying beds within public hospitals (including both mental health and non-mental health presentations).
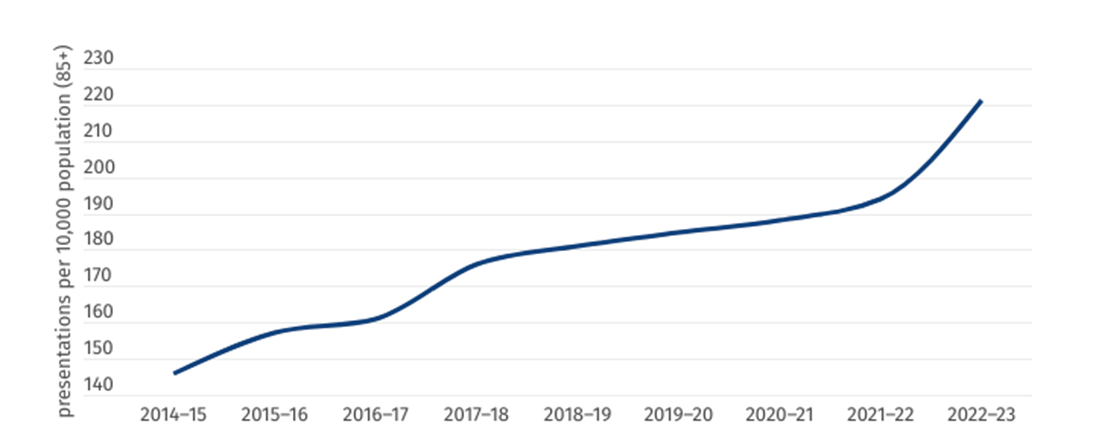
Older Australians are also increasingly presenting to emergency departments with mental health issues. While these illnesses are mostly categorised as “organic, including symptomatic, mental disorders”, which include disorders such as Alzheimer’s disease and dementia, these patients often experience a complex set of interwoven mental and physical illnesses, presenting doctors with an incredibly complex challenge
Figure 12: Mental health-related presentations, 85 and over, per 10,000 population
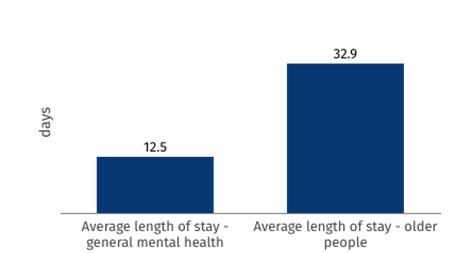
In the case that a patient over 65 is admitted to hospital with a mental health disorder, they are likely to stay in hospital almost three times longer than the average length of stay (32.9 days for “older people mental health services”, 12.5 days for average length of stay for “general mental health services”).
Figure 13: Average length of stay – mental health patients (2022/23)
While our members advise most older patients will not necessarily fill specialised mental health beds, these statistics highlight the changing nature of mental health for older Australians. Overall, all statistics relating to Australia’s aging population point to the pressing need for greater investment to future-proof the capacity of our public hospitals.