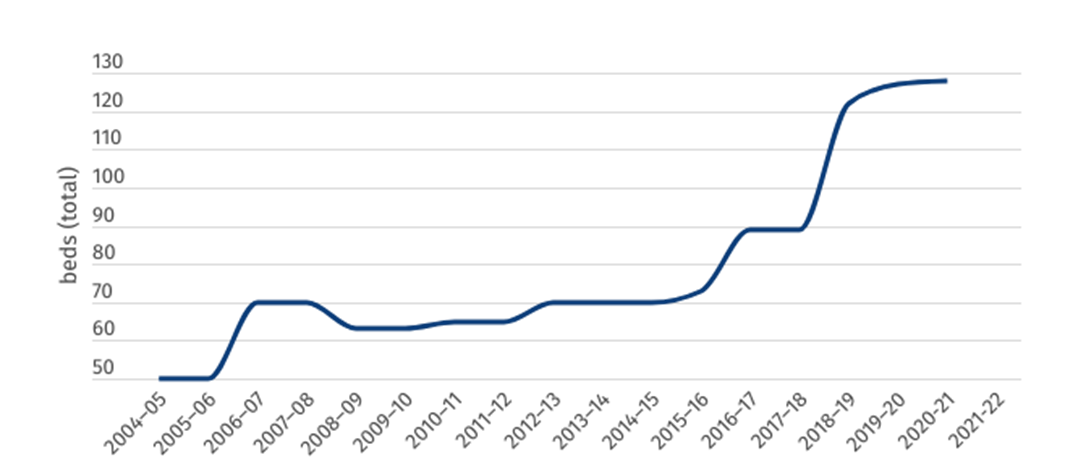
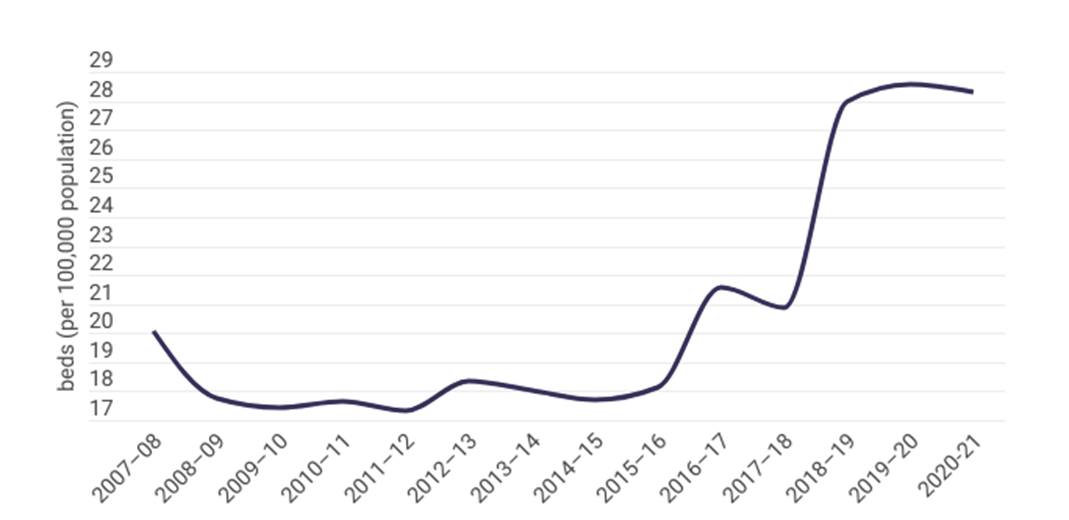
Mental health capacity in public hospitals
Unfortunately, there is no data available for 2021–22.
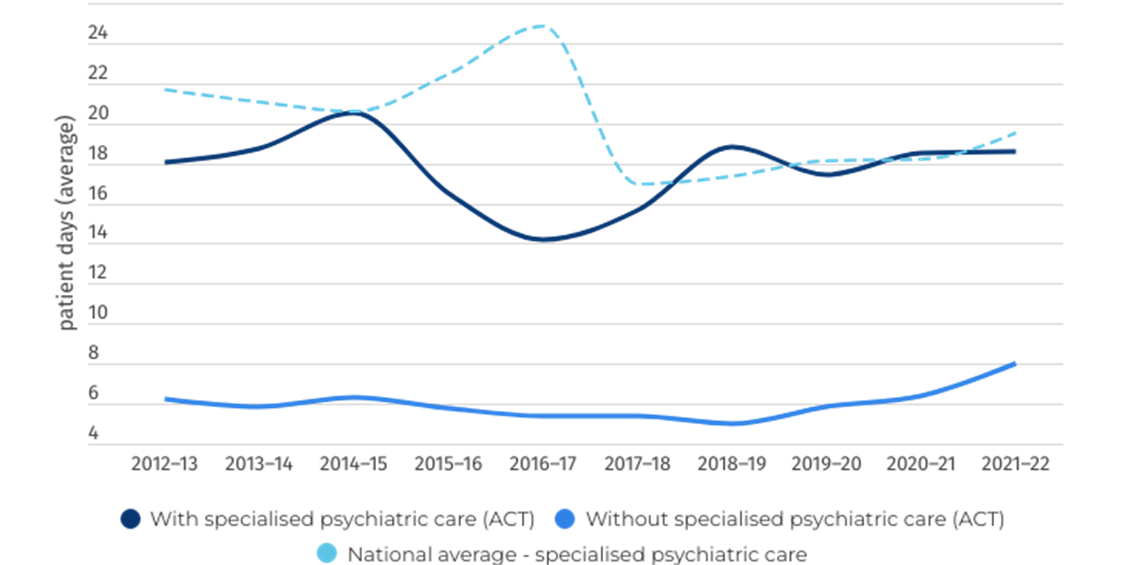
While the ACT remains poor in sharing of up-to-date data, investment in mental health beds over the past decade has translated to a much-needed increase in per-person mental health capacity.